

Volume 28 Number 3
Poor pelvic floor health is associated with frailty in 40–75 year olds
Susan Jayne Gordon, Karen Anne Grimmer and Nicky Baker
Keywords frailty, pelvic floor, middle aged, ageing
For referencing Gordon SJ, Grimmer KA and Baker N. Poor pelvic floor health is associated with frailty in 40–75 year olds. Australian and New Zealand Continence Journal 2022; 28(3):59-70.
DOI
https://doi.org/10.33235/anzcj.28.3.59-70
Submitted 17 February 2022
Accepted 27 July 2022
Abstract
To determine the associations between pelvic floor health and frailty, and to identify variables associated with them, this study involved 656 community-dwellers aged 40–75 years who participated in a cross-sectional observational study. Participants completed the Pelvic Floor Bother Questionnaire and the Fried frailty phenotype assessment, and were assessed for putative predictors (sleep quality, body mass index, nutrition, psychological distress, hydration, smoking, alcohol, polypharmacy and health concerns). Differences were tested using analysis of variance models and chi square tests, and associations were tested using linear and logistic regression models. Bladder and bowel concerns were reported by men and women in all age groups, and 38% of participants exhibited at least one frailty element. There was a significant association between reporting frailty elements and poor pelvic floor health, and both were significantly associated with increasing age for men and women, poor sleep quality and high body mass index. Only pelvic floor health was significantly associated with health concerns and polypharmacy, and only frailty was significantly associated with smoking and alcohol consumption. Significant associations with alterable lifestyle and general health factors suggest that early interventions to improve pelvic floor health could impact on health and healthy ageing more broadly.
Introduction
Approximately 21% of Australians aged 15 years and over report urinary incontinence (UI) (4.2 million) and/or faecal incontinence (FI) (1.3 million)1. Prefaced on population ageing, the frequency of UI and FI is estimated to increase to 27% by 20302.
Female UI is associated with childbirth (muscle and nerve damage), pelvic organ prolapse, pelvic muscle weakness, and age-related deterioration in tissue structure and function3. Male UI is usually related to health concerns associated with ageing, such as enlarged prostate gland3. Compromised faecal health includes stool leakage, uncontrolled expulsion of faecal gas, and constipation, with prevalence ranging from 2.8–30.7%3,4. Faecal incontinence is not considered as a direct physiological consequence of ageing4. However, both UI and FI are associated with poor health and lifestyle behaviours, such as inadequate hydration, poor diet and exercise patterns, and reduced mobility5.
Public understanding of UI and FI is generally poor, even in health-literate people6. This potentially leads to under-reporting of pelvic floor health (PFH) problems and may explain why 50–70% people who report UI do not seek professional help1,2. Embarrassment and social stigma add to UI and FI under-reporting7, masking true prevalence1,2. Over half (52.9%) of women with UI believe it was inevitable with age, 22% believed they should cope with the problem themselves, and 14% thought no useful treatment was available8. Ultimately, UI and FI are common reasons for eventual admission to residential aged care9.
Proposed predictors of UI and FI include high BMI5,7, parity, coughing, osteoporosis and arthritis, gender, low health literacy10, heavy lifting10, poor hydration11, poor diet12 and smoking13. Moreover, UI has been associated with frailty14,15 via common factors including older age, multiple medical conditions and polypharmacy, psychological distress, and poor self-assessed health16–19.
Most frailty research has been conducted on people aged 65 years and over18, a decision variably based on government census population categories, retirement age, pension eligibility, and beliefs that frailty is an issue for older adults only20,21. This focus does not incorporate the notion that individual functional deficits can commence earlier (for instance, in middle age), and accrue over time18. While it is accepted that changes in function occur with increasing age, it is not age per se that determines the trajectory of frailty, rather a combination of factors related to genetic inheritance, lifestyle choices, attitude, sociodemographic variables and luck16,20,22. It is increasingly recognised that some 70 year olds may function as well as someone aged 55 years, whilst some 55 year olds may function in the manner of someone much older16,18,20–22.
The relationship between PFH, frailty and measures of wellbeing, health, physiology and function has not been explored in people younger than 65 years. Moreover, frailty assessments for older people inconsistently include pelvic floor function23. Thus, if the Australian estimates of UI and FI are to be believed, and if poor PFH is a precursor for frailty, then improving pelvic floor performance in middle age may prevent or delay progression to frailty as people age.
Methods
Ethics approval was obtained from Southern Adelaide Local Health Network (South Australia) (391.16). This paper conforms to the principles embodied in the Declaration of Helsinki. Return of online surveys implied consent. All participants provided signed consent prior to objective assessment which included use of data for publication.
A cross-sectional, observational study was designed with the aim to explore associations between poor PFH and frailty in order to estimate the impact of putative predictors for both poor PFH and frailty (age, sex, diet, hydration, body mass index (BMI), sleep quality, regular medications, tobacco smoking, overall health, and psychological stress).
Direction of association
Poor PFH was the primary exposure for frailty. Associations between PFH and frailty were assessed in gender–age categories because of known gender differences in PFH3, and the known effect of increasing age3 on PFH and frailty4. Diet, hydration, BMI, sleep quality, regular medications, alcohol consumption, tobacco smoking, overall health, and psychological distress were analysed as independent suggested predictors of both PFH and frailty5.
Sampling and data collection
We previously provided detailed information on the sampling approach and study methods24. In summary, the sample included 656 volunteers recruited in 2017–2018 from three large municipal councils, staff of metropolitan branches of a national bank, and staff at a large university. Recruitment occurred by multiple initiatives, including email invitation, local media messages, posters, presentations by researchers to community groups, and snowballing (asking interested participants to invite friends and family)22,24. Consenting participants completed self-reported measures (online or on paper), and attended local testing stations where researchers completed physical assessments24.
Sample size estimate
As there is scant information on the prevalence of poor PFH or frailty in community-dwelling Australians aged 40–75 years, broad estimates were extrapolated from the literature. We used the CDC Epi InfoTM sample size calculator for population studies to estimate a minimum sample size25. We assumed a local reference population size from the most recent census figures of 500,000 adults aged 40–75 years in the city where this research was conducted. We applied estimated prevalence in the youngest age group (40–49 years) of any symptom of poor bladder or bowel health of 30%3,4, and 5% prevalence of three or more elements of frailty26, margin of error 5%, 80% power, and four age clusters (40–49 years; 50–59 years; 60–69 years; 70+ years). At least 60 participants were required in each cluster to confidently assess prevalence of PFH and frailty. As the study examined multiple associations which incurred potential Type 1 errors27, we sought to recruit at least 120 participants in each age cluster (minimum sample of 480).
The Pelvic Floor Bother Questionnaire (PFBQ) is a psychometrically-sound instrument developed to identify, and assess severity of, pelvic floor concerns28. The PFBQ contains questions regarding: urine leakage, urgency, frequency and discharge; constipation and faecal leakage; and dyspareunia (pain during sexual intercourse). For each item, respondents note concern=1, no concern=0, and then rate the level of bother with each concern (‘not at all’ (0) to ‘a lot’ (4))24. This paper reports only the five bladder (urine leakage during physical activities; frequency of urination; urgency to urinate; leakage associated with urgency; discomfort on urinating) and two bowel (constipation; faecal gas) health questions relevant to both men and women; the female-only questions on pelvic bulging and dyspareunia were excluded. To provide an overall summary of PFH for ease of describing the problem, we combined the bladder and bowel health measures into pelvic floor concerns and pelvic floor bother measures. However, we largely kept bladder and bowel measures separate for analysis, on the understanding that they may exert different impacts on frailty elements.
Frailty assessment
We established individual frailty scores by summing binary scores assigned to each Fried frailty phenotype element16 – unintentional weight loss in the past 6 months, low regular exercise and exhaustion (all self-reported) – and objectively measured poor grip strength and slow walking pace. Low regular exercise was determined as less than the median Australian recommended time spent walking per week, and no moderate and vigorous exercise29. Exhaustion was self-reported as item 1 in the 10-item psychological distress questionnaire K1030. Grip strength was measured in sitting by dynamometry, and poor grip strength was determined as measures lower than age-gender population norms31. Slow walking pace was determined as measures above the 80th percentile distribution of the difference between actual walking speed and age-gender population norms for the Six Minute Walk Test (6MWT)32.
Putative predictor variables
Age was calculated in parts of years from date of birth. Gender was self-nominated as male or female. Psychological distress was the sum of items 2–10 in the K1030 (item 1 Exhaustion was already included in Fried frailty phenotyping); the higher the score, the greater the psychological distress. BMI was calculated from height (metres) and weight (kilograms). A food intake score was calculated from an Australian food behaviours survey33, in which daily good food choices included eating: five or more vegetable serves; two or more fruit serves; mostly wholegrain fibre daily and an alternative cereal weekly; at least two serves of dairy; and one or more servings of lean meat. Poor food choices were regularly consuming sugary drinks, processed foods and takeaways. Higher food intake scores indicated better nutrition. Hydration was self-reported as ‘drinking plenty of water’ (or not)33. Sleep quality was measured by the Pittsburgh Sleep Quality Index (PSQI)34 where higher scores indicated poorer sleep quality. Smoking was self-reported, as was medication (the number of regular medications), and general health (overall health concerns).
Data management
The seven relevant PFBQ items (five bladder, two bowel) were each reported as 1=concern, 0=no concern28. Total bladder and bowel concern scores were derived by summing the relevant binary responses (bladder concerns possible total 5, bowel concerns possible total 2). For every bladder or bowel concern, the PFBQ captured a bother score ranging from 0 (not at all) to 4 (a lot). Bother scores were calculated by multiplying each concern by the amount of reported bother. To avoid misinterpretation when multiplying a concern (scored 1) by the no bother score (0), we added 1 to each bother score (0+1, through to 4+1). We then calculated total bladder bother and total bowel bother subscores (total bladder bother score minimum=5, maximum=25; total bowel bother score minimum=2, maximum=10).
Participants were classified not frail if they reported no Fried frailty phenotype element, pre-frail if they reported one or two elements, and frail if they reported three or more elements16.
Age was reported as a scaled variable and in 9-year categories (40–49 years, 50–59 years, 60–69 years, 70–75 years). Eight gender–age subgroups were established for stratum-specific analysis (males aged 40–49 years, females aged 40–49 years etc).
Classification of variables
Scaled variables were total bladder and bowel concerns, total bladder and bowel bother scores, age, psychological distress, BMI, food intake and sleep quality. Categorical variables were: frailty (not frail, pre-frail, frail); adequate hydration (Yes, No); concerns about general health (Yes, No); current smoking (Yes, No); and regular medications (none, 1–4, and 5+)35.
Data analysis
Overall bladder and bowel health scores were reported descriptively (means, Standard Deviations (SD), median, 25th and 75th percentile, interquartile range (IQR), Shapiro-Wilks test of normal distribution, p values). All study measures were described as means for scaled measures (SD), or percentages (for frequency), in age-gender categories. Differences between age-gender categories were tested by Analysis of Variance (ANOVA) models for scaled variables, or chi square (chi2) tests for categorical variables. The likelihood of any bladder or bowel concern being reported in each gender–age group was tested using odds ratios (OR) (95%CI), with the reference category being men aged 40–49 years.
Mean total bladder and bowel concerns, and total bladder and bowel bother scores were calculated for the three frailty categories (Table 3), and differences across categories were tested by ANOVA models. Frequency of categorical variables were tested for each frailty category (Table 4) and differences between categories were established by chi square tests. Mean (SD) total bladder and bowel concerns and bowel bother scores were calculated for categorical variables of regular medication use, adequate hydration, smoking, alcohol consumption and health concerns overall, and in gender–age subgroups. Binary categories of frailty (with the reference category being no frailty) were compared in gender–age group categories using logistic regression models, with the output reported as OR (95%CI).
Measures of PFH (total bladder and bowel concerns, and total bladder and bowel bother scores) were tested in linear regression models as the dependent variables, to determine associations with scaled predictor variables (sleep quality, nutrition, BMI). The output was reported as r2 values, F values, degrees of freedom (df) and p values overall, and then deconfounded by gender and age. We reported the mean bladder and bowel measures for each level of each categorical predictor variable, with differences reported as F values, df and p values.
Significance
Associations were considered to be significant if 95%CI around OR did not include 1. Findings from ANOVA models or chi square tests were significant if the F value for the degree of freedom was greater than the threshold value, and the associated p value was <0.05. Findings from linear regression models were significant if the r2 value was greater than 5%, the F value for the degree of freedom was greater than the threshold value, and the associated p value was <0.05.
Statistical software
Analyses were conducted using CDC Epi InfoTM Version 7.2.3.125 and SAS Version 9.436.
Results
Sample
There were 656 participants (66.76% female; mean age 59.94 years (SD 10.62)). The sample compared well with local age and gender population estimates, and local socioeconomic indices37.
Pelvic floor health
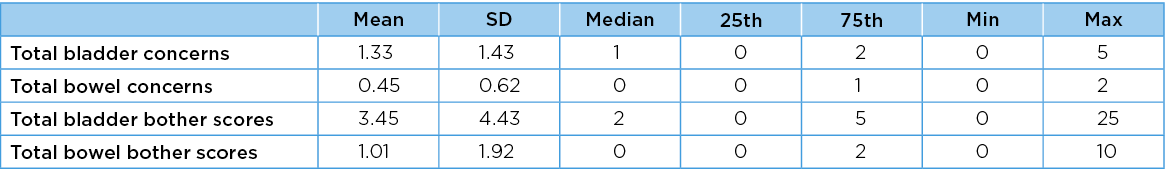
Descriptive statistics for estimates of PFH for the entire sample are reported in Table 1. None of the frequency distributions for the four PFH measures was normally distributed, as evidenced by Shapiro-Wilks statistics <0.90 and significant p values. Transforming these distributions by squaring or log transformation did not significantly improve their normality, thus these variables were applied to linear regression models in their natural form, with caveats on interpreting the outputs38.
Table 1. Descriptive statistics for PFH (bladder and bowel)
Gender–age group differences
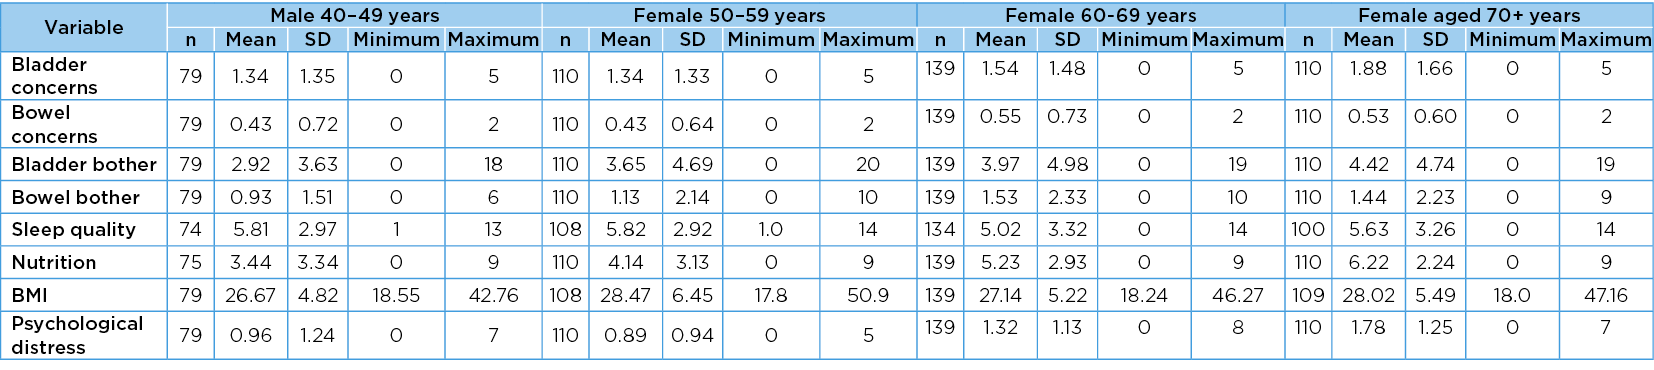
The mean values, SD, minimum and maximum values of each scaled variable in gender–age group categories are reported in Table 2a and Table 2b. There were significant positive differences across the gender–age groups in all scaled measures except BMI (F=1.82 (p=0.12). The significant measures were the total number of bladder concerns (F=4.51, p=<0.001), total number of bowel concerns (F=4.14, p=<0.001); total bladder bother score (F=4.17, p=<0.001); total bowel bother score (F=3.43, p=<0.001); sleep quality (F=2.33, p=0.02); nutrition (F=11.42, p=<0.001) and psychological distress (F=11.62, p=0.002).
Table 2a. Values in age group categories: males
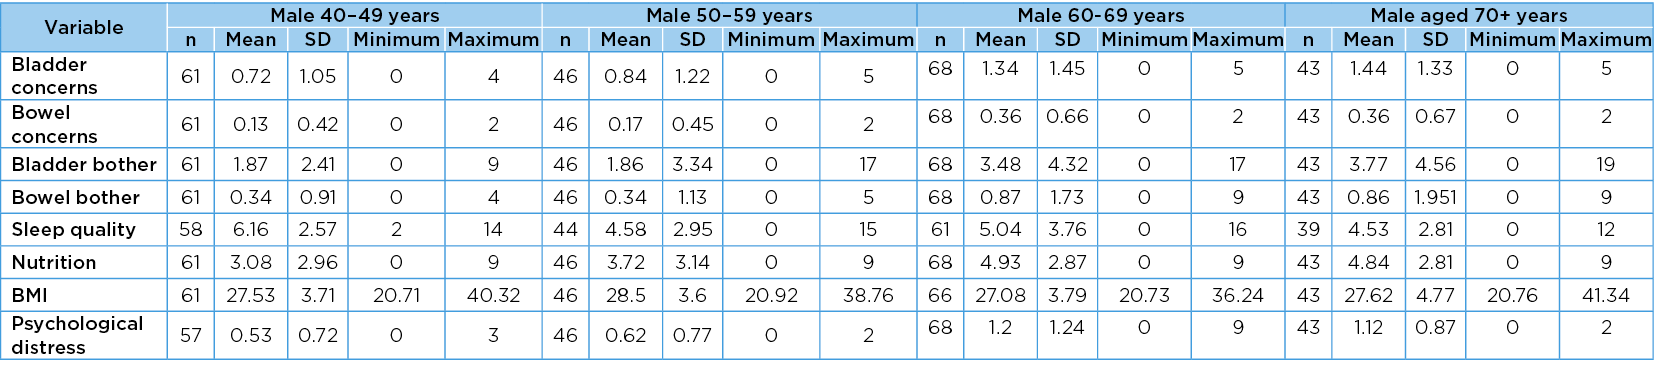
Table 2b. Values in age group categories: females
PFH according to age
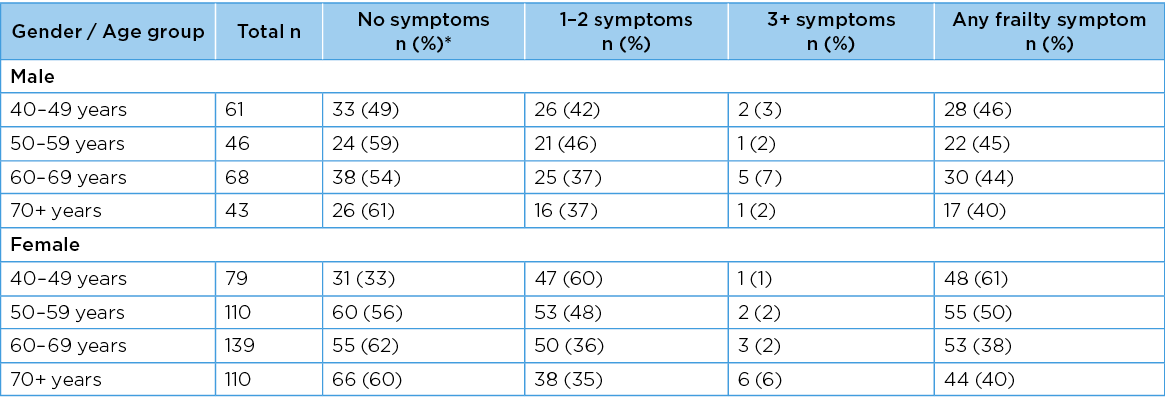
Men and women in each age group reported poor PFH in terms of bladder as well as bowel concerns. There was a significant overall increase in the frequency of bladder concerns reported by men as they aged (chi2 for trend 11.22, df=1, p=<0.001); however, this same pattern was not observed for women (chi2 for trend 1.17, df=1, p=0.31)). This suggests that the rate with which women reported any bladder concern remained relatively constant as they aged. Whilst at least one bowel problem was also reported in each gender–age group, there was no significant increase in frequency with increasing age (chi2 for trend 3.55 df=1 p=0.06) for men; 2.32, df=1, p=0.13) for women). The gender–age group numbers, frequencies and OR (95%CI) for any bladder or bowel concern are reported in Table 3. The frequency with which the number of PFH concerns was reported overall in the sample, and by men and women, is described as percentages in Figure 1.
Table 3. Risk of any bladder or bowel concern occurring in each age group
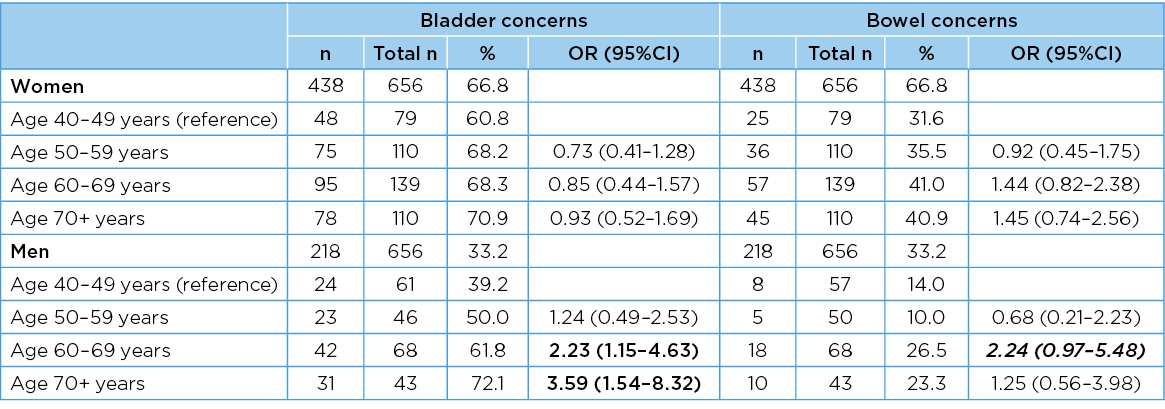
Significant associations are bolded; associations that are trending towards significance are bolded in italics. Percentages are rounded
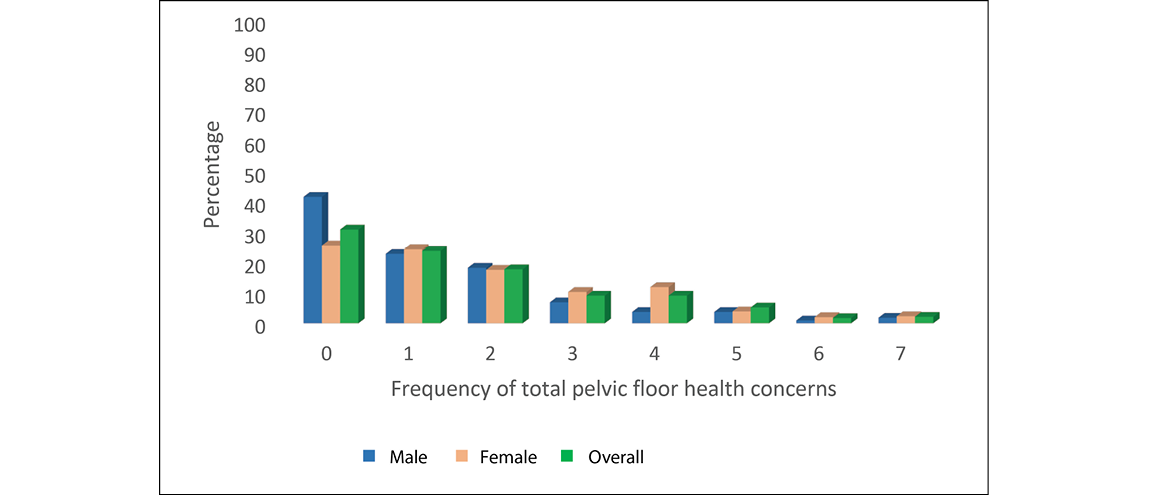
Figure 1. Frequency of total PFH concerns for male, female and overall
Differences across gender–age categories for categorical variables
The gender–age frequencies of categorical variables are reported in Table 4. There were significant gender–age differences across all but one categorical variable (smoking (chi2=10.22, df=7, p=0.17). The variables with significant gender–age differences were frailty chi2=29.56, df=14, p=0.009; health concerns chi2=56.34 df=7, p=<0.001; alcohol chi2=40.84, df=14, p=<0.001; hydration chi2=32.77, df=14, p=0.001; regular medications chi2=96.62, df=14, p<0.001). In general, as people aged, their scores became poorer in all these variables.
Frailty: No frailty element was reported by N=359 participants (54.72%) (determined as ‘not frail’). One or two elements (pre-frail) were reported by N=276 participants (42.07%) and three or more elements (frail) were reported by N=19 participants (2.89%).
Table 4. Age group frequencies of categorical variables (n=656)
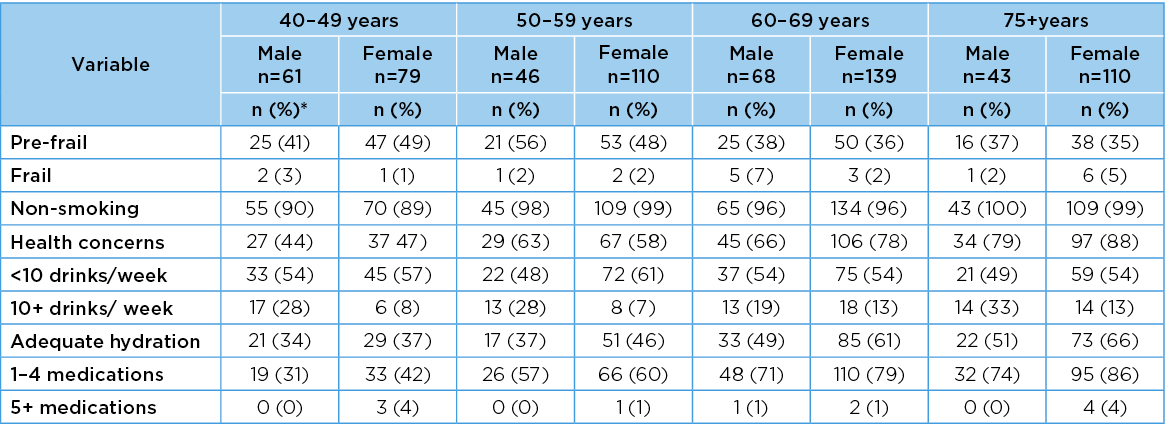
* Percentages are rounded
Differences across frailty categories for scaled variables
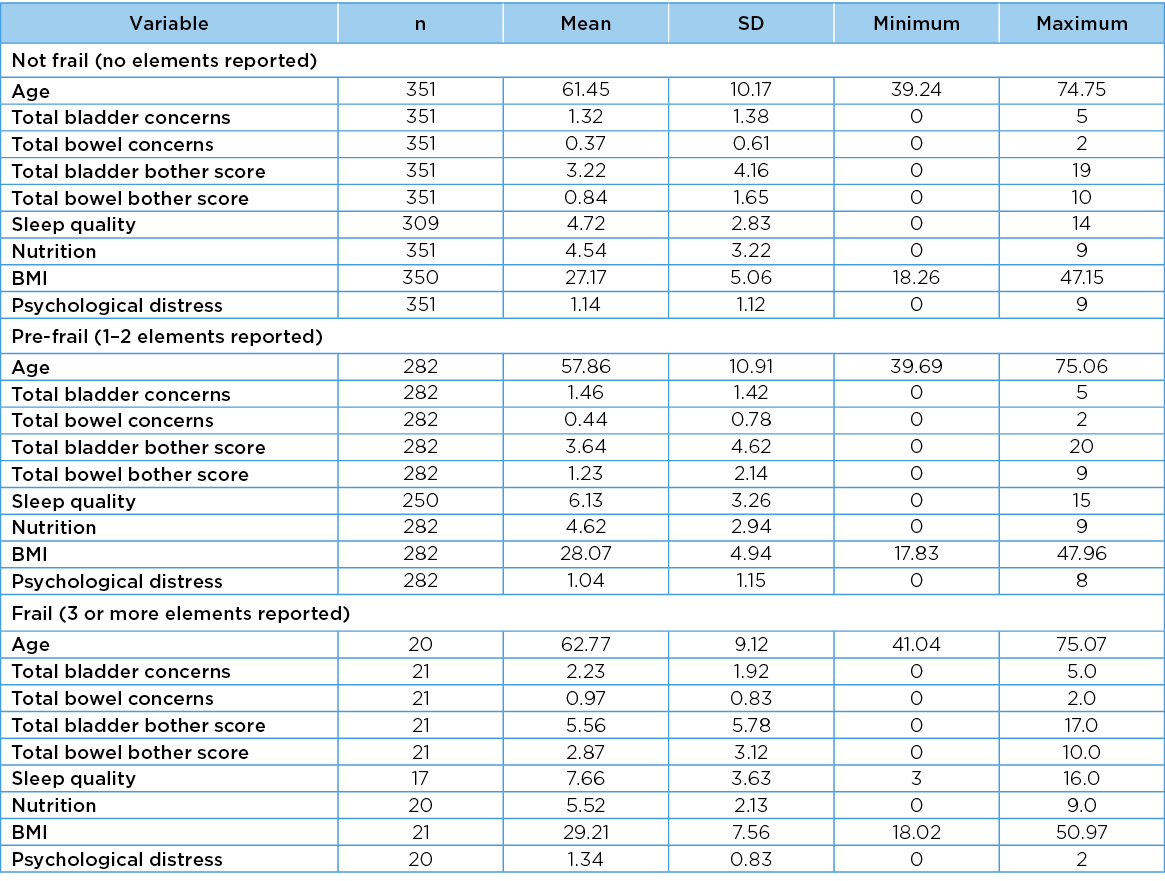
The mean values, SD, minimum and maximum values for each scaled variable in each frailty category are reported in Table 5. There were significant differences across frailty categories for six variables: age (F=11.92, df=2, p=<0.001); total bladder concerns (F=4.87, df=2, p=0.009); total bowel concerns (F=9.46, df=2, p=<0.001); total bowel bother concerns (F=12.14, df=2, p<0.001); sleep quality (F=21.36 df=2 p<0.001); and BMI (F=3.85, df=2, p=0.02). In general, the scores for these predictor variables became poorer as the number of frailty elements increased. The differences trended towards significance for total bladder bother scores (F=3.01, df=2, p=0.05), but there were no significant differences across frailty categories for nutrition (F=1.15, df=2, p=0.3) or psychological distress (F=0.97, df=2, p=0.4).
Table 5. Variables in frailty categories
Differences across frailty categories for categorical variables
The frequency with which categorical variables occurred in frailty categories is reported in Table 6. There were significant differences across frailty categories only for smoking (chi2=9.42, df=3, p=0.009); and alcohol intake (chi2=<0.001, df=4, p=0.002). There were no differences across frailty categories for gender (chi2=0.97, df=2, p=0.63); health concerns (chi2=1.95, df=2, p=0.39); hydration (chi2=2.94, df=2, p=0.23); or regular medications (chi2=1.35, df=4, p=0.8).
Table 6. Frequencies of categorical variables in frailty categories
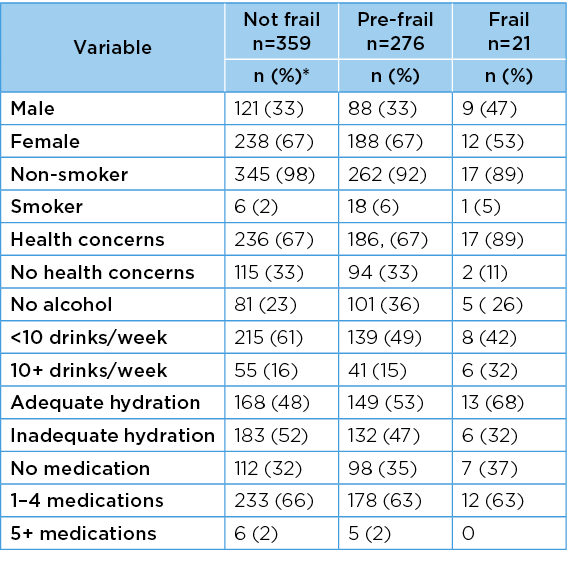
Missing data n=4
*Percentages are rounded
Frailty in gender–age groups
The frequency with which frailty elements were reported, and the odds of any frailty element (95%CI) being reported, did not change significantly with increasing age for men (chi2 for trend 0.52, df=3, p=0.55), but they did change for women (chi2 for trend 11.91, df=3, p=0.001). For men, there was no significant change in risk when comparing the frailty elements in progressively older age groups, compared with the reference youngest age group. However, for women, each progressively older age group had significantly protective odds of any frailty element being reported compared with the youngest age group (Tables 7 & 8).
Table 7. Frequency of frailty indicators in age groups
*Percentages are rounded
Table 8. Any frailty symptoms being reported in age groups
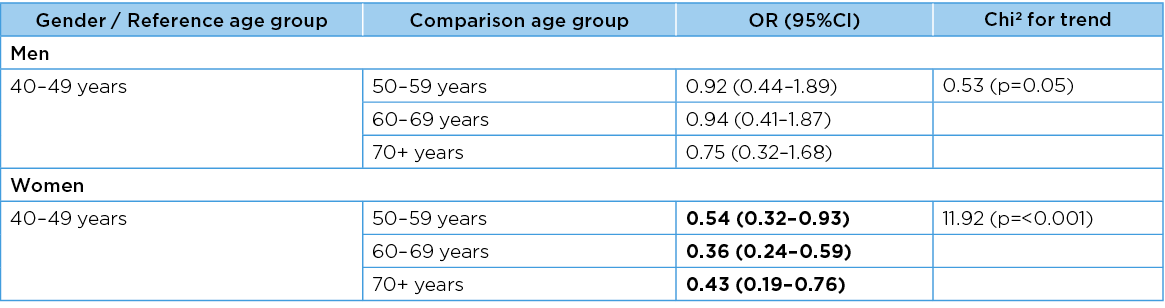
Significant associations are bolded
Increasingly poor PFH across frailty categories, using 95%CI around the means of total bladder, total bowel and total PFH concerns, and total bladder, total bowel and total pelvic floor bother scores are illustrated in Figure 2. There was considerable variability in scores as indicated by the width of the 95%CI, particularly for pelvic floor bother scores. The measure that provided the clearest indication of decreasing PFH with increasing frailty was total bladder concerns.
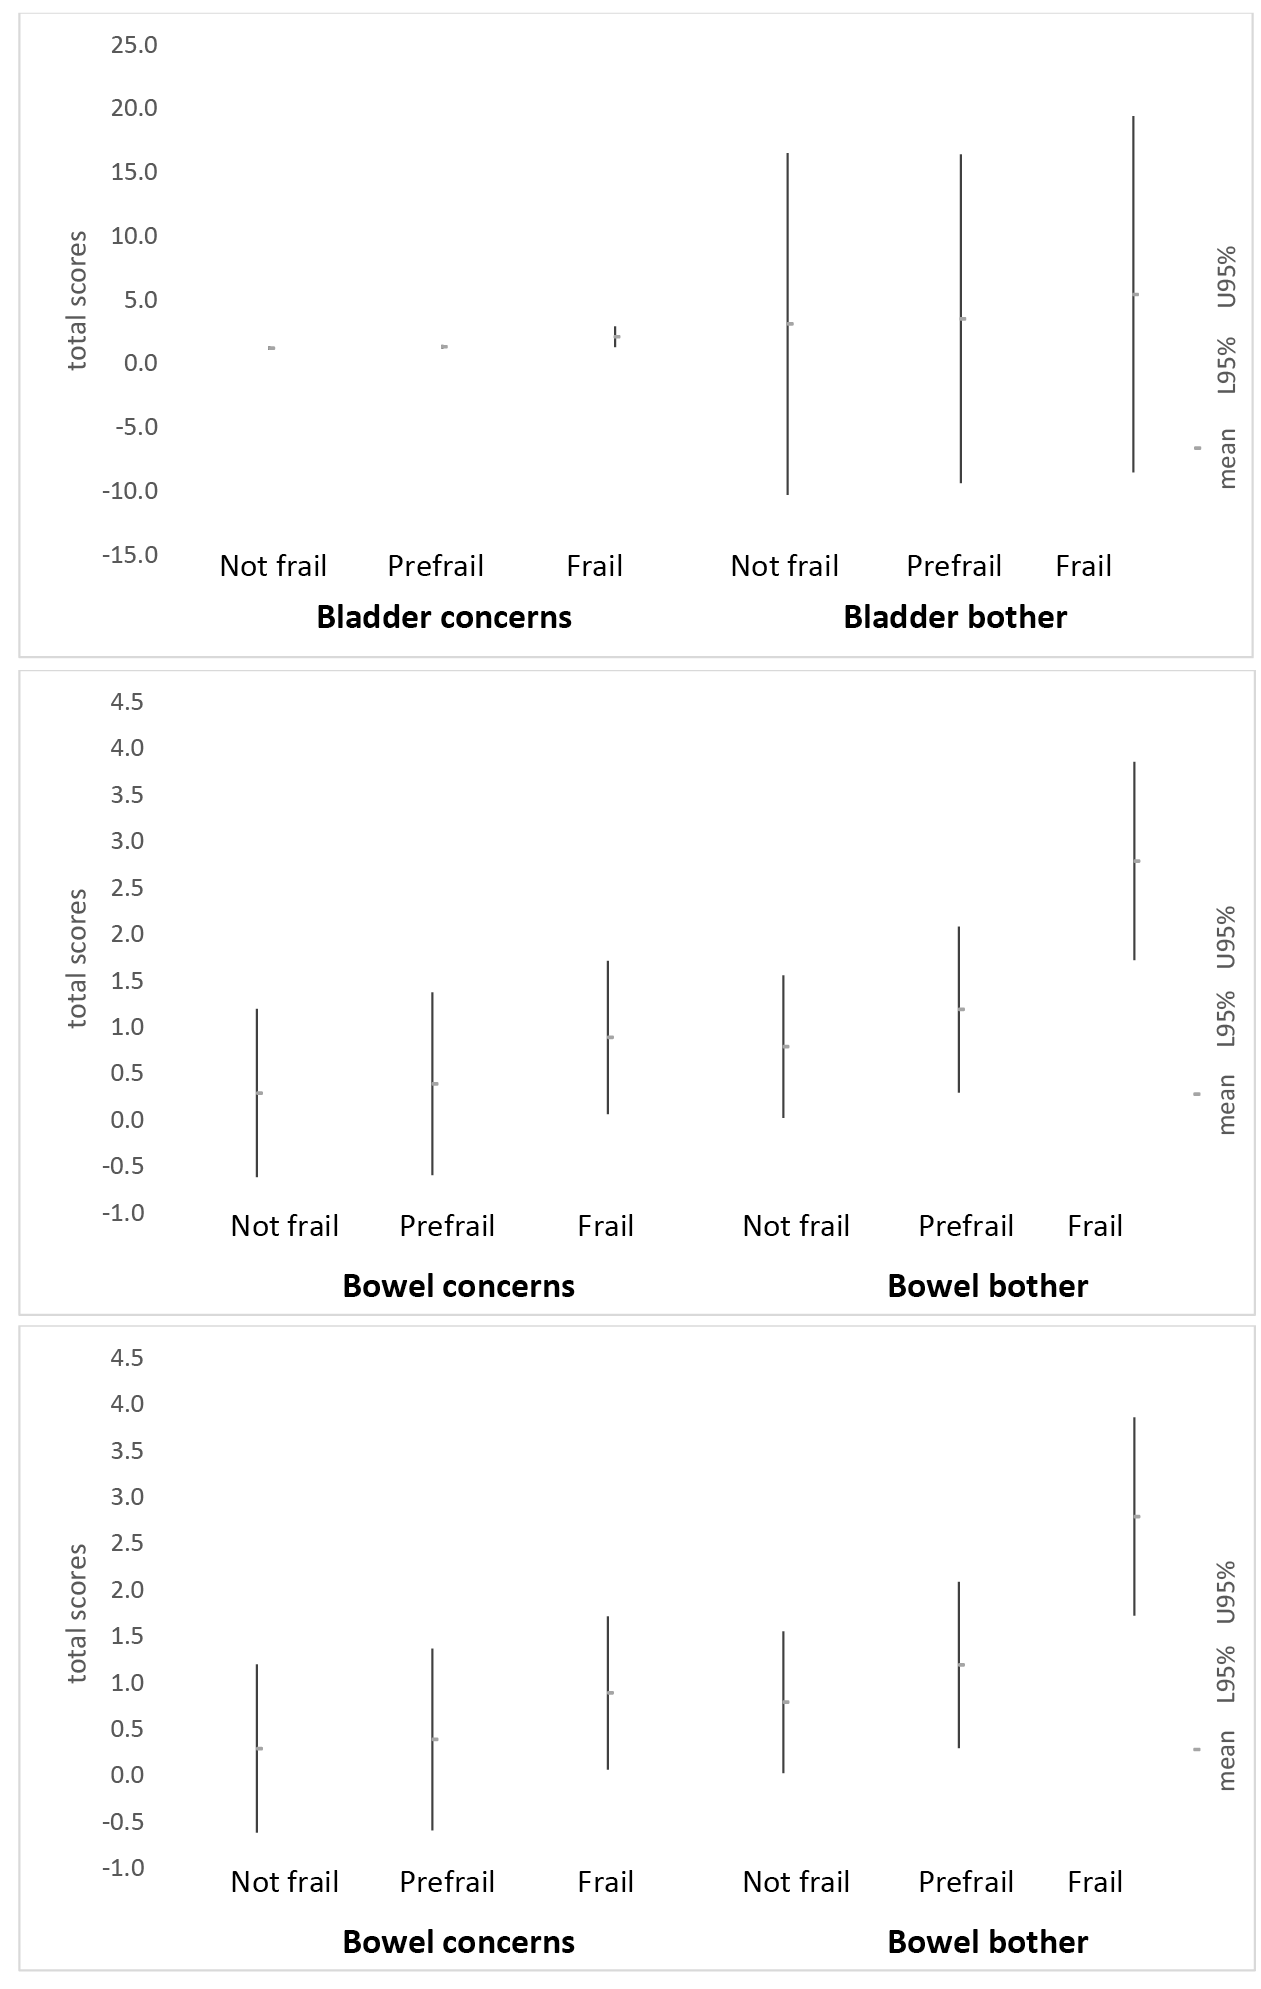
Figure 2. Mean scores for bladder, bowel and total PFH (95%CI) in frailty categories
Associations between PFH and scaled predictor variables
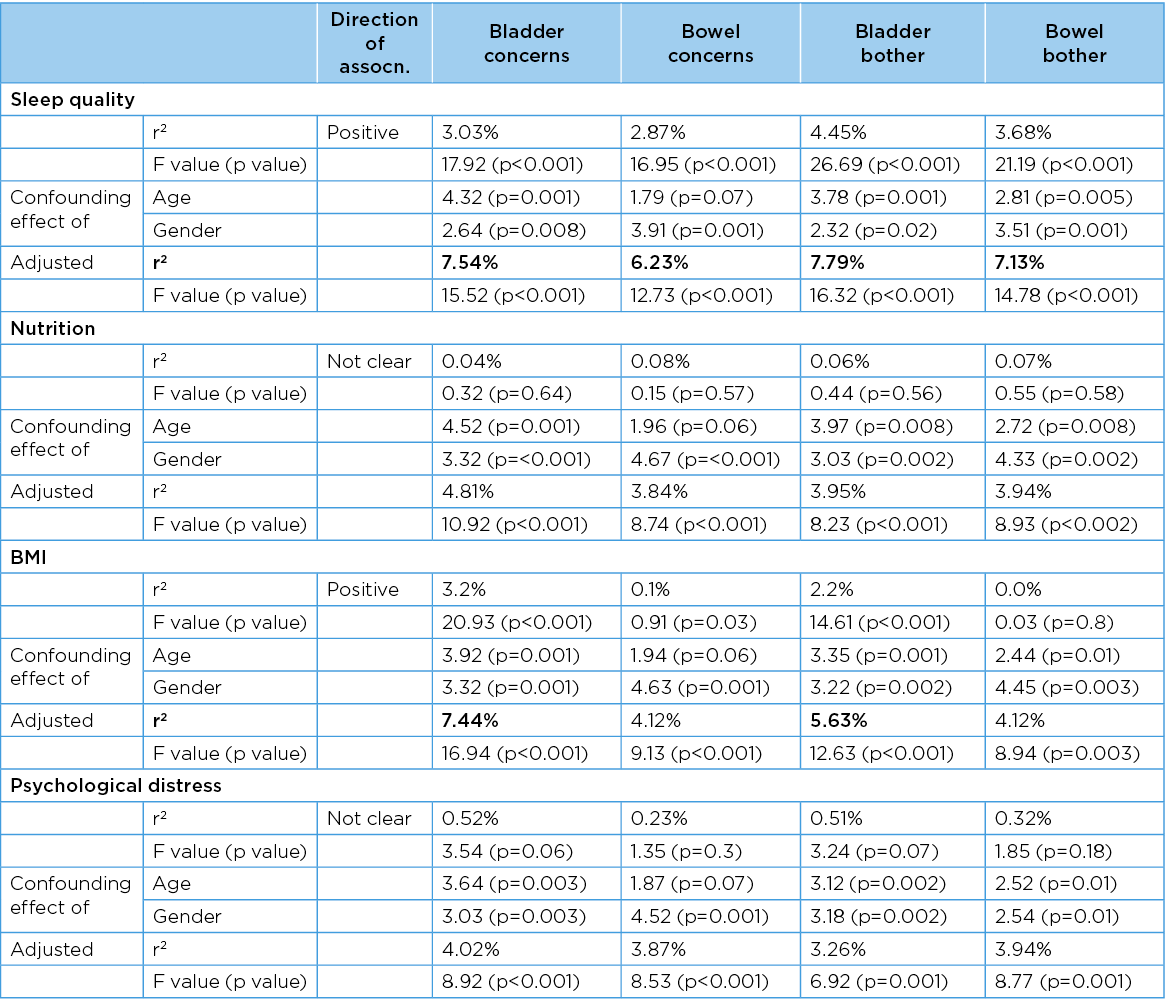
The crude associations between all PFH and scaled predictor variables, and adjusted associations by age and gender, are reported in Table 9. Sleep quality was significantly associated with all four PFH measures in both crude and adjusted forms (sleep quality decreased as PFH decreased). BMI was significantly associated with bladder health measures in both crude and adjusted forms, and with bowel health only in adjusted form (BMI increased as PFH decreased). Nutrition and psychological distress were not associated with any PFH measure in crude form, but all associations became significant after adjusting by age and gender.
Table 9. Crude and adjusted associations between PFH and integer predictor variables
Associations between PFH and categorical predictor variables
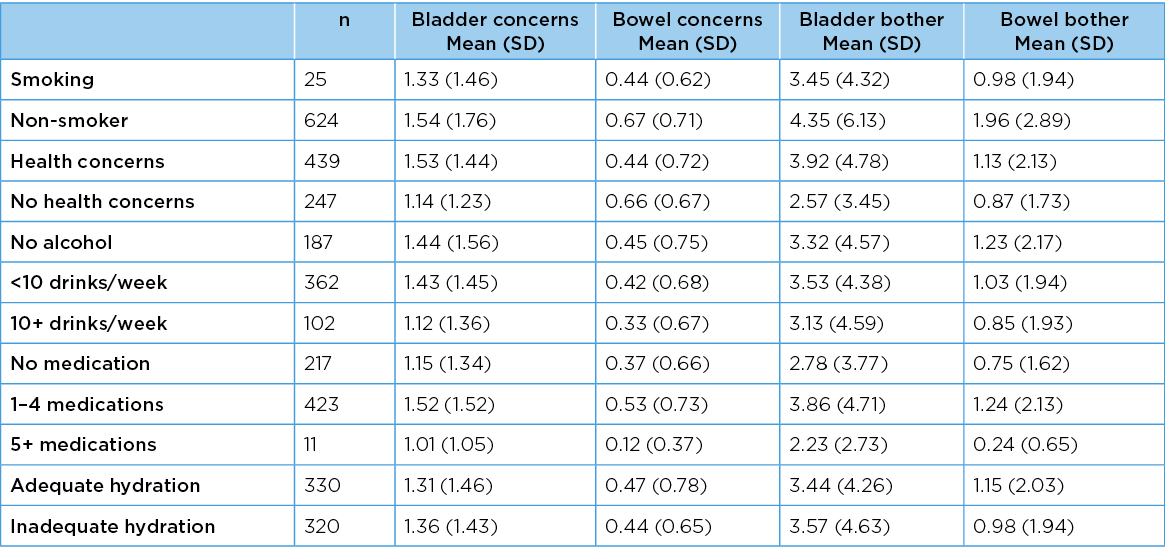
Table 10 reports the mean scores (SD) for PFH measures and categorical variables. There was a significant difference between bowel bother scores for smoking (or not) (F=5.25, df=1, p=0.03) (more bowel bother found for smokers). No other PFH measure was affected by smoking (bladder concerns F=0.34, df=1, p=0.6; bladder bother F=2.94, df=1, p=0.08; bowel concerns F=1.18 df=1, p=0.3). Expressing health concerns was reflected in significant differences in bladder and bowel concerns, and bowel bother, respectively F=11.13, df=1, p=<0.001; F=14.42, df=1, p=<0.001; F=4.43, df=1, p=0.003) (more health concerns expressed by people with poorer PFH). There was no difference in bladder bother with, or without, health concerns (F=1.91, df=1, p=0.2). There were no significant differences in any PFH measure for hydration (sufficient, not) and alcohol intake (none, 1–9 drinks per week, 10+ per week).
For adequate hydration, ANOVA outputs were, respectively, bladder concerns (F=0.01 df=1 p=0.9;2 bowel concerns (F=0.02, df=1, p=0.94; bladder bother F=0.17, df=1, p=0.76; bowel bother F=0.26, df=1, p=0.73). For alcohol intake, ANOVA outputs were respectively, bladder concerns (F=1.35, df=2, p=0.37; bowel concerns (F=1.66, df=2, p=0.22; bladder bother F=0.42, df=2, p=0.78; bowel bother F=1.04, df=2, p=0.47). There were significant differences for all PFH measures and regular daily medication frequency (none, 1–4 daily. 5+ daily) (bladder concerns F=4.48, df=2, p=0.01; bowel concerns (F=5.65, df=2, p=0.004; bladder bother F=4.94, df=2, p=0.008; bowel bother F=5.98, df=2, p=0.003). Polypharmacy (5+ regular medications) was associated with poorer PFH.
Table 10. PFH measures and categorical predictor variables
Discussion
This is the first study to investigate the relationship between frailty and PFH in community-dwelling adults aged 40–75 years. This sample is mostly younger than those recruited for frailty research. Our sample is generalisable to similarly-aged Australians in other cities, and the PFH and frailty findings concur with international studies1–3,22. Concurring with other studies of similar ages, symptoms of poor PFH were found in all gender–age groups2,4,5.
Over 40% of participants overall, and at least 38% participants in any gender–age subgroup, exhibited one or more frailty elements16. This concurs with recent large-scale population findings in the United Kingdom, suggesting that pre-frailty occurs regularly in middle-age21. Moreover, our findings of significant relationships between increasing frailty and decreasing PFH concur with other research14,15. This lends weight to the inclusion of PFH questions in comprehensive frailty assessments23.
A summary of the relationships between variables assessed in this study is shown in Figure 3. We found clear evidence that poor PFH is an important exposure for frailty elements for both genders. Both poor PFH and frailty share common predictors for both men and women (increasing age, poor sleep quality, high BMI). However, only poor PFH was associated with health concerns and polypharmacy, whilst only frailty was associated with smoking and regular alcohol intake.
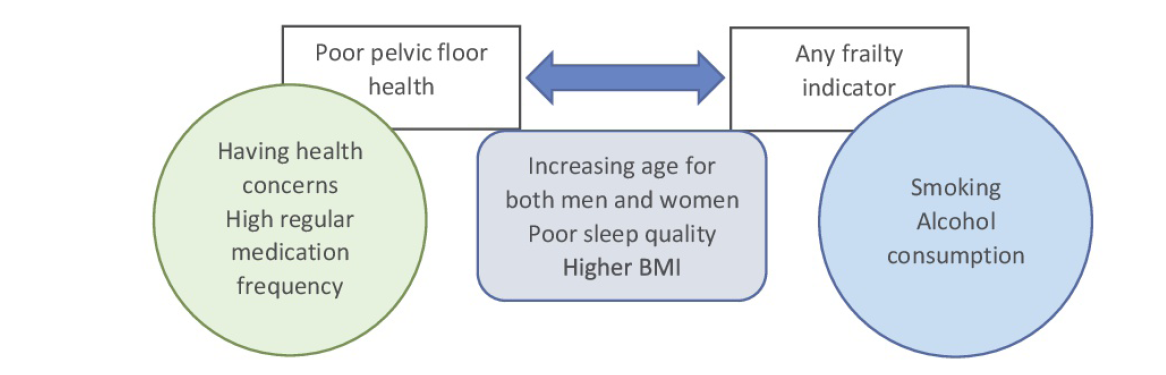
Figure 3. Relationship between PFH and frailty indicators, showing significant predictor variables
In light of the complex epidemiology of frailty16,18,20,21, the roles of PFH and sleep quality require further investigation in middle aged and ‘young’ old people to determine how it impacts on frailty predictors. We could not explore how poor PFH is associated with sleep quality, as nocturia was not measured. Nocturia can result from medical conditions, not just pelvic floor function3,5,7,9,10. Targeted research is required to understand the factors related to poor sleep quality and psychological distress, and how these factors relate to PFH and frailty.
The concerning number of men and women in their 40s and 50s who reported poor PFH suggests that interventions could be effective for those whose pelvic floor structures are still sufficiently healthy for function to be retrained5,7,8,14. This may possibly prevent progression to chronicity. However, reasons for poor performance of pelvic floor structures in middle-aged people needs to be better understood before effective interventions can be determined. The importance of poor sleep quality and high BMI on both frailty elements and PFH in our study suggests a sound starting point for public health education. High BMI is usually associated with an imbalance between exercise and food intake39. Inadequate exercise is one of the five Fried frailty elements, whilst nutrition was not associated with frailty or PFH in our study. High BMI may affect PFH by increasing biomechanical and gravitational pressures on pelvic floor structures, and it may explain why individuals do not exercise as often as guidelines recommend (perhaps resulting in slower walking speeds, poor grip strength and/or feeling exhausted). As noted previously, poor sleep quality may be related to frequent nocturnal disturbances for toileting. Further research is required into the factors involved in frailty progression, and when these factors first impact on frailty elements.
Limitations
The research has a number of limitations. The sample is potentially biased by self-selection. We recruited at least 120 participants in each age category (40–49 years n=140; 50–59 years n=156; 60–69 years n=207; 70+ years n=153), and thus the study was adequately powered. However, the sample may include people who believed that they had health problems and wanted evidence of such, as well as people who wanted evidence that they did not have health problems and were well for their age. There were very few participants with three or more elements of frailty, and thus frailty was considered in analysis as the presence of one or more frailty elements. Our analyses were thus largely driven by the number of people classified as ‘pre-frail’. The small number of frail participants is not surprising, given that our sample was younger than the samples on which frailty research has been conducted in the past16,18–20. Given the opportunistic recruitment in our study, types I and 2 errors may well have influenced the significance of comparisons. The impact on the generalisability of the findings from this sample is perhaps evident in the significantly protective odds of frailty for progressively older women compared to those aged 40–49 years. It may be that the older women who participated in our study were healthier than their counterparts in the general population.
The cross-sectional design of this study precluded consideration of causality. There were sound a priori reasons to propose that poor PFH was an exposure for frailty3,4; however, the directionality of impact, and the causal role of putative predictors, could not be determined in this study design. For instance, poor PFH, high BMI or taking regular medications may impact on sleep quality, which may in turn be a more proximal exposure for frailty than bladder health as it may have influenced frailty elements such as exhaustion. High BMI may be independently associated with frailty elements such as slow walking speed, poor regular exercise or weak grip strength, and therefore BMI may not act on frailty through poor PFH exposure.
The non-normal distribution of the PFH measures potentially affected the estimation of associations with predictor variables39. Summing the scores for pelvic floor concerns assumed that each concern was of the same importance. The PFH bother measures were re-scaled such that people who reported a concern (1), but were not bothered by it (scored 0), could be differentiated from those people who reported no concern (0) (and therefore had no bother (0)). The equal interval assumptions around the ‘bother’ scaling (‘not-at all’ to ‘a lot’) assumed linearly-escalating bother; however, this may not be an appropriate interpretation. More research is required to determine the magnitude of the steps between the subsequent bother categories, as well as the real impact on daily living, of poor PFH.
Conclusion
This community-dwelling sample was mostly younger than that used in frailty research. It demonstrated consistent prevalence of pelvic floor concerns and pre-frailty. The significant associations between PFH, frailty, sleep quality and BMI suggests that early interventions to improve PFH could optimise health more broadly and healthy ageing.
Conflict of interest
The authors declare no conflicts of interest.
Funding
This work was supported by an internal grant from Flinders University and ACH Group through their co-funding of Chair of Restorative Care in Ageing, Professor Susan Gordon.
Author(s)
Susan Jayne Gordon*
Caring Futures Institute, College of Nursing and Health Sciences, Flinders University, Adelaide, SA, Australia
Email Sue.gordon@flinders.edu.au
Karen Anne Grimmer
College of Nursing and Health Sciences, Flinders University, SA, Australia 5042
Division of Physiotherapy, Faculty of Medicine and Health Science, Stellenbosch University, Cape Town, South Africa
Nicky Baker
Caring Futures Institute, College of Nursing and Health Sciences, Flinders University, Adelaide, SA, Australia
*Corresponding author
References
- Australian Institute of Health and Welfare (AIHW). Incontinence in Australia. Cat. no. DIS 61. Canberra: AIHW; 2013.
- Deloitte Access Economics. The economic impact of incontinence in Australia. Continence Foundation of Australia; 2011.
- Abrams P, Andersson KE, Apostolidis A, Birder L, Bliss D, Brubaker L, and members of the committees. 6th International Consultation on Incontinence. Recommendations of the International Scientific Committee: evaluation and treatment of urinary incontinence, pelvic organ prolapse and faecal incontinence. Neurourol Urodyn 2018;37:2271–2272.
- De Giorgio R, Ruggeri E, Stanghellini V, Eusebi LH, Bazzoli F, Chiarioni G. Chronic constipation in the elderly: a primer for the gastroenterologist. BMC Gastroenterol 2015;15:130. doi:10.1186/s12876-015-0366-3
- Trantafylidis SC-A. Impact of urinary incontinence on quality of life. Pelviperineol 2009;28:51–53.
- Wang DS, Jani AB, Tai CG, et al. Severe lack of comprehension of common prostate health terms among low-income inner-city men. Cancer 2013;119:3204–11.
- Vasconcelos CTM, Firmiano MLV, Oriá MOB, Neto JAV, Saboia DM, Bezerra LR. Women’s knowledge, attitude and practice related to urinary incontinence: systematic review. Int Urogynecol J 2019;30:171–180. doi:10.1007/s00192-018-3759-3.
- Ng SF, Lok MK, Pang SM, Wun YT. Stress urinary incontinence in younger women in primary care: prevalence and opportunistic intervention. J Womens Health (Larchmt) 2014;23:65–8.
- Wagg A, Potter J, Peel P, Irwin P, Lowe D, Pearson M. National audit of continence care for older people: Management of urinary incontinence. Age Ageing 2008;37:39–44.
- Zeleke BM, Bell RJ, Billah B, Davis SR. Symptomatic pelvic floor disorders in community-dwelling older Australian women. Maturitas 2016;85:34–41. doi:10.1016/j.maturitas.2015.12.012.
- Benelam B, Wyness L. Hydration and health: a review. Brit Nut Found Nut Bull 2010;35:3–25.
- Dallosso H, Matthews R, McGrother C, Donaldson M. The Leicestershire MRC Incontinence Study Group. Diet as a risk factor for the development of stress urinary incontinence: a longitudinal study in women. Eur J Clin Nut 2004;58:920–926.
- Mobley D, Baum N. Smoking: its impact on urologic health. Rev Urol 2015;17:220–225.
- Miles TP, Palmer RF, Espino DV, Mouton CP, Lichtenstein MJ, Markides KS. New-onset incontinence and markers of frailty: data from the Hispanic established populations for epidemiologic studies of the elderly. J Gerontol: Series A 2001;56:M19–M24.
- Berardelli M, De Rango F, Morelli M, et al. Urinary incontinence in the elderly and in the oldest old: correlation with frailty and mortality. Rejuvenation Res 2013;16:206–11.
- Fried LP, Tangen CM, Walston J, et al. Cardiovascular Health Study Collaborative Research Group. Frailty in older adults: evidence for a phenotype. J Gerontol A Biol Sci Med Sci 2001;56:M146–56.
- Finkelstein MM. Medical conditions, medications, and urinary incontinence: analysis of a population-based survey. Can Fam Phys 2002;48:96–101.
- Rockwood K, Mitnitski A. Frailty in relation to the accumulation of deficits. J Gerontol: Series A 2007;62:722–727.
- Clegg A, Young J, Iliffe S, Olde Rikkert M, Rockwood K. Frailty in elderly people. Lancet 2013;382:1328.
- Xue Q-L. The frailty syndrome: definition and natural history. Clin Geriatr Med 2011;27:1–15.
- Hanlon P, Nicholl BI, Jani BD, Lee D, McQueenie R, Mair FS. Frailty and pre-frailty in middle-aged and older adults and its association with multimorbidity and mortality: a prospective analysis of 493,737 UK Biobank participants. Lancet Pub Hlth 2018;3:e323–e332.
- Gordon SJ, Baker N, Kidd M, Maeder A, Grimmer KA. Pre-frailty factors in community-dwelling 40–75 year olds: opportunities for successful ageing. BMC Ger 2020;20(1):96.
- Dent E, Kowal P, Hoogendijk EO. Frailty measurement in research and clinical practice: a review. Eur J Int Med 2016;31:30–10.
- Gordon S, Grimmer K, Baker N, Marin T. Feasibility of population screening tests of establish a healthy ageing trajectory. SAGE Open Med 2019;7:1–9.
- Centers for Disease Control and Prevention (CDC). Epi Info™ v.7.2. Available from: https://www.cdc.gov/epiinfo
- Thompson MQ, Theou O, Karnon J, Adams RJ, Visvanathan R. Frailty prevalence in Australia: findings from four pooled Australian cohort studies. Aust J Ageing 2018;37(2):155–158.
- Haynes W. Bonferroni correction. In: Dubitzky W, Wolkenhauer O, Cho KH, Yokota H, editors. Encyclopedia of systems biology. New York, NY: Springer; 2013. doi:10.1007/978-1-4419-9863-7_1213
- Peterson TV, Karp DR, Aguilar VC, Davila GW. Validation of a global pelvic floor symptom bother questionnaire. Int Urogynecol J 2010;21:1129–35.
- Australian Institute of Health and Welfare (AIHW). The active Australia survey: a guide and manual for implementation, analysis and reporting. Canberra: AIHW; 2003. Available from: https://www.aihw.gov.au/reports/physical-activity/active-australia-survey/contents/table-of-contents.
- Andrews G, Slade T. Interpreting scores on the Kessler Psychological Distress Scale (K10). Aust NZ J Publ Hlth 2001;25:494–497.
- Dodds RM, Syddall HE, Cooper R, et al. Grip strength across the life course: normative data from twelve British studies. PLoS One 2014;4:9(12):e113637.
- Jenkins S, Cecins N, Camarri B, Williams C, Thompson P, Eastwood P. Regression equations to predict 6-minute walk distance in middle-aged and elderly adults. Physiother Theory Pract 2009;25:516–22.
- National Health and Medical Research Council (NHMRC). Australian dietary guidelines. Canberra (ACT): NHMRC; 2013. Available from: https://www.nhmrc.gov.au/guidelines-publications/n55.
- Smyth C. The Pittsburgh Sleep Quality Index (PSQI). Am J Nurs 2008;108:47–48.
- Masnoon N, Shakib S, Kalisch-Ellett L, et al. What is polypharmacy? A systematic review of definitions. BMC Geriatr 2017;17, 230.
- SAS Institute Inc. Base SAS® 9.4 Utilities: Reference. Cary: NC; 2013.
- Australian Bureau of Statistics (ABS). The 2016 census community profiles / Greater Adelaide; 2016. Available from: https://www.abs.gov.au/census/find-census-data/community-profiles/2016/4GADE
- Schneider A, Hommel G, Blettner M. Linear regression analysis. Dtsch Arztebl Int 2010;107(44):776–782.
- Gearon E, Peeters A, Ng W, Hodge A, Backholer K. Diet and physical activity as possible mediators of the association between educational attainment and body mass index gain among Australian adults. Int J Pub Hlth 2018 Sep;63(7):883–93.