

Volume 28 Number 3
Factors associated with poor bladder health in community-dwelling Australians aged 40–75 years
Susan Jayne Gordon, Karen Anne Grimmer and Nicky Baker
Keywords Bladder, public health, associates, middle aged
For referencing Gordon SJ, Grimmer KA and Baker N. Factors associated with poor bladder health in community-dwelling Australians aged 40–75 years. Australian and New Zealand Continence Journal 2022; 28(3):52-58.
DOI
https://doi.org/10.33235/anzcj.28.3.52-58
Submitted 9 November 2022
Accepted 27 July 2022
Abstract
The objective of this study was to identify significant predictors of poor bladder health in middle-aged and older community-dwelling Australians that may be addressed by public health interventions. A cross-sectional study recruited 656 volunteers aged 40–75 years in one Australian state capital city. We report bladder health in this paper, measured as the summed non-sex-specific bladder health questions (N=5) in the Pelvic Floor Bother Questionnaire (PFBQ). Associations between bladder health and putative predictors identified from the literature (age; sex; health concerns; polypharmacy; smoking; cognition; nutrition; alcohol intake, regular exercise; body mass index; walking speed) were examined. Bladder health was tested as a scaled variable in three categories (no problems, some problems and many problems). Univariate linear regression models, chi square models and analysis of variance models were applied to test strength of associations. Significant crude associations between predictors and poor bladder health were stratified by gender and age groups (40–49 years, 50–59 years, 60–69 years and 70+ years) to test for confounding. The sample comprised 218 men and 438 women. Increasing age, high body mass index, slow walking speed and health concerns were significant crude predictors of poor bladder health. Gender and age were significant confounders of all these associations. Broad public health interventions that promote regular physical activity to people aged 45–75 years may result in faster walking speeds and lower body mass index, which in turn may improve general health, and prevent and improve poor bladder health.
Introduction
Poor pelvic floor health (PFH) can reflect one or more concerns such as involuntary urine or faecal leakage, urinary frequency or urgency, or constrained or painful voiding of bladder or bowel1. Globally, unintentional loss of urine is the most common manifestation of pelvic floor dysfunction2–5. Pelvic floor health is defined as "the physical and functional integrity of the pelvic floor unit through the life stages of an individual (male or female), permitting an optimal quality of life through its multifunctional role, where the individual possesses or has access to knowledge, which empowers the ability to prevent or manage dysfunction"2(p.991). Poor PFH is often under-reported and under-treated due to embarrassment or stigma, and there appears to be widespread acceptance that signs and symptoms of incontinence are a normal part of ageing3–5.
Poor PFH can significantly impact on physical and mental wellbeing and quality of life6,7 and is reported to contribute to chronic urinary tract infection, interrupted sleep and subsequent fatigue, reduced physical activity, and compromised mental health8–10. This can curtail social and recreational activities which can further impact on physical and mental health9. Persistent urinary and/or faecal leakage are common reasons for older people to enter residential care9,10.
Our recent report of the prevalence of poor PFH in Australian community-dwelling adults highlighted a range of intimate bladder and bowel concerns that many otherwise healthy people experienced every day11. Factors commonly associated with poor PFH in women often relate to childbirth3–5. However, non-sex-specific causal factors for poor PFH have also been proposed, for instance obesity, compromised cognition, poor nutrition, sedentary lifestyles, polypharmacy, and regular smoking and alcohol consumption12–18. Although poor PFH is not a simple topic to address in a public health sense, some proposed associated factors could be addressed via public health better lifestyle campaigns, health promotion, education and individual pharmaceutical and non-pharmaceutical approaches2–5,12–18.
This paper reports data from a cross-sectional observational study11,19 to identify factors associated with bladder health in community dwelling adults aged 40–75 years. We interrogated the data to seek information on which putative predictors were significantly associated with bladder health in community-dwelling adults aged 40–75 years? Do gender and age influence the association between significant predictors and bladder health?
Methods
This study was approved by the Southern Adelaide Clinical Human Research Ethics Committee (South Australia) (391.16).
Study sampling and data collection methods were previously reported11,19. In summary, volunteers aged 40–75 years who were generally healthy and living in the community were recruited for a general health assessment. Consenting participants completed surveys for self-reported measures (online or on paper) and objective physical assessments (conducted face-to-face with researchers).
Comprehensive information on PFH was captured using the Pelvic Floor Bother Questionnaire (PFBQ)20; this tool was identified as the most appropriate instrument to measure PFH in community-dwelling adults from the range of instruments recommended by the 6th International Consultation on Incontinence21. The relevance and acceptability of PFBQ was confirmed by the expert reference group for our study19. Of 656 community-dwelling participants aged 40–75 years, we found that 65% overall (70% women, 56% men) reported experiencing at least one bladder concern regularly21. Women were almost twice as likely than men to report bladder concerns across all age groups – OR 1.9 (95%CI 1.4–2.8). Bowel problems were less frequently reported, by fewer than 10% men and women across the age groups11. Bladder health was reported as the summed score of the five PFBQ items relevant to bladder health for both men and women (binary questions 1a–5a; urine leakage during physical activities; frequency of urination; urgency to urinate; leakage associated with urgency; discomfort on urinating). For analysis, this bladder health variable was treated as a scaled variable, and also in three categories of good bladder health (no problems) (scores 0,1), moderate bladder health (some problems) (scores 2,3) and poor bladder health (many problems) (scores 4,5).
As reported in the literature predictors of poor PFH such as older age and female gender are widely accepted1–7. Age was calculated from birthdate, in years, and for analysis was treated as a scaled variable and put into categories (40–49 years, 50–59 years, 60–69 years, and 70–75 years). Sex was a binary variable. Other predictors were identified from a comprehensive literature search19. Three scaled variables were derived from summed scores from questionnaires:
- Cognition, measured by the General Practitioner Assessment of Cognition test (GPCOG), where each correct answer scored one point (for a total of nine)22,23.
- Nutrition, scored as the sum of self-report binary responses to questions from the Australian Dietary Guidelines Eat for Health24, with scores assigned to daily intake of vegetable, fruit, primary protein, choosing wholegrains and eating a weekly substitute grain, and limiting fast foods, processed foods and high sugar foods.
- Regular exercise, determined from the total number of self-reported minutes per week spent walking, on moderate-exertion activity, vigorous exertion exercise, and gardening (Active Australia Survey25).
There were two continuous predictor variables:
- Body mass index (BMI) was calculated by weight (kgs)/height2 (metres). BMI is a measure of general body health17,26.
- Walking speed was assessed by the Six Minute Walk Test (6MWT) standardised by height27,28. Walking speed is an objective indicator of physical fitness and overall health (reported for this paper in metres per second)29.
Categorical predictors comprised:
- Currently smoking (self-reported) Yes/No)30.
- Polypharmacy (self-reported) (measured as no regular medications, one to four regular medications, or more than five regular medications)31,32.
- Alcohol consumption (self-reported) classified as none, less than 10 drinks per week (acceptable intake), or more than 10 (at-risk intake)33.
- Individual health concerns (self-reported from the question ‘Do you have any other concerns about your health that we haven’t asked you about today?’ Answer options were Yes/No6,7,9,10,18.
Data management
We tested for normalcy of the frequency distributions of the scaled variables using the Shapiro-Wilks test, where significant p values indicated non-normal distributions. We described each distribution by mean, standard deviation (SD), median, count, minimum and maximum, and 25th and 75th percentiles. None of the frequency distributions were normal. After adding 1 to each summed score to avoid the challenges of zero values, we log transformed the total bladder score so that it approximated a normal distribution for subsequent analysis34.
For scaled predictor variables, univariate linear regression models (Pearson r2 values) were constructed to test crude associations between the scaled bladder health scores and BMI, walking speed, cognition, exercise and nutrition34. Significant crude associations were identified by F values (p<0.05), and r2 values provided estimates of strength of associations. Gender (binary) and age (continuous) were then added as dummy variables to the models with significant crude associations to test for confounding. Significant confounding effects were identified by F values with p values <0.05 and significant increases in the adjusted r2 values from the crude value. Mean values and SD for each predictor variable were reported across each category of bladder health, and significant differences between means were assessed using analysis of variance (ANOVA) models and reported as F values, degrees of freedom (df), p values.
Where the variables included categorical data, a different statistical analysis was required. Chi square models were reported as degrees of freedom (df), p values and tested differences in the number of subjects in each cell of categorical cross-tabulations. Differences in bladder health scores between the levels of categorical putative predictors were tested using ANOVA models, reporting F values (df) and p values. Where significant crude differences were identified (p<0.05), sex and age group were added as independent variables to the ANOVA models, to test for confounding.
Results
Of the 656 participants, 439 (67%) were female, the mean sample age was 59.9 years (SD 10.6) and, as previously reported, the cohort was comparable with local age, sex and socio-economic population estimates13,21,35. Descriptive statistics are reported for the five-item non-gender-specific bladder score n=656 (mean 1.3, SD 1.4; median 1 (IQR 0–2) (range 0–5)). This demonstrated the non-normal frequency distribution of the overall response variable. Table 1 reports the descriptive statistics for the sex-age categories of the bladder health score. Table 2 reports descriptors of the frequency distributions of the predictor variables.
Table 1. PFBQ non-sex-specific bladder health questions (N=5) per age group
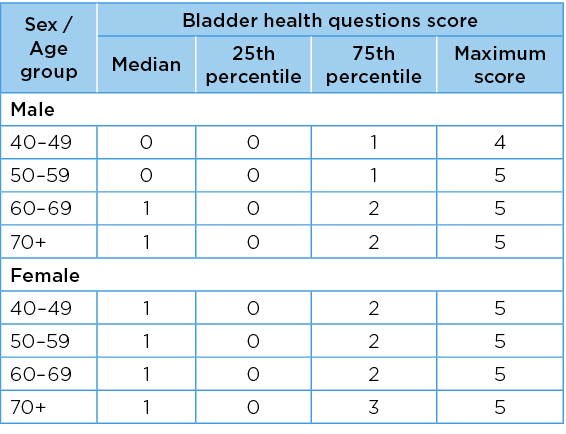
Table 2. Descriptors of frequency distributions of the predictor variables
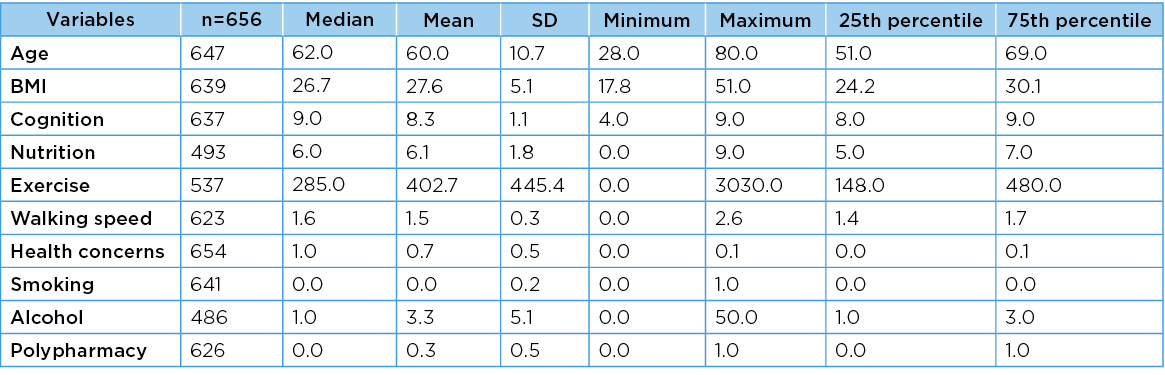
Legend: Unit measures: Age (years) , BMI (weight/height2 ) Cognition (GP COG score) Nutrition Australian Dietary Guidelines Eat for Health24 , Exercise (minutes/day) , Walking speed (6MWT) minutes , Health concerns Yes or No, Smoking Yes or No , Alcohol (standard drinks/week), Polypharmacy (measured as no regular medications, one to four regular medications, or more than five regular medications)
As anticipated from our previous research into individual PFBQ bladder elements21, there were significant gender and age group effects (overall F=6.9, df=4 (p<0.05), effect of sex F=11.5 (p=0.02), age group effect F=5.4 (p=0.001. A higher percentage of men than women reported suffering all five bladder elements, approximately 5% men aged 50–59 years and over 70 years, compared with 3% for women aged 50–59 years and 3% for women aged over 70 years. There were no gender differences in those participants reporting all five bladder elements.
The mean and SD, minimum and maximum values for each scaled predictor variable for three levels of bladder health are reported in Table 3. There were no significant differences across these bladder health categories for cognition (F=1.1, df=2 p=0.32); nutrition (F=0.1 df=2 p=0.92); or exercise (F=1.0 df=2, p=0.35). However, significant differences were found for walking speed (F=11.5, df=2, p=<0.001); and BMI (F=7.2, df=2, p=<0.001). Scatter plots of the associations between bladder health and cognition, nutrition, exercise, walking speed and BMI are provided in Figure 1.
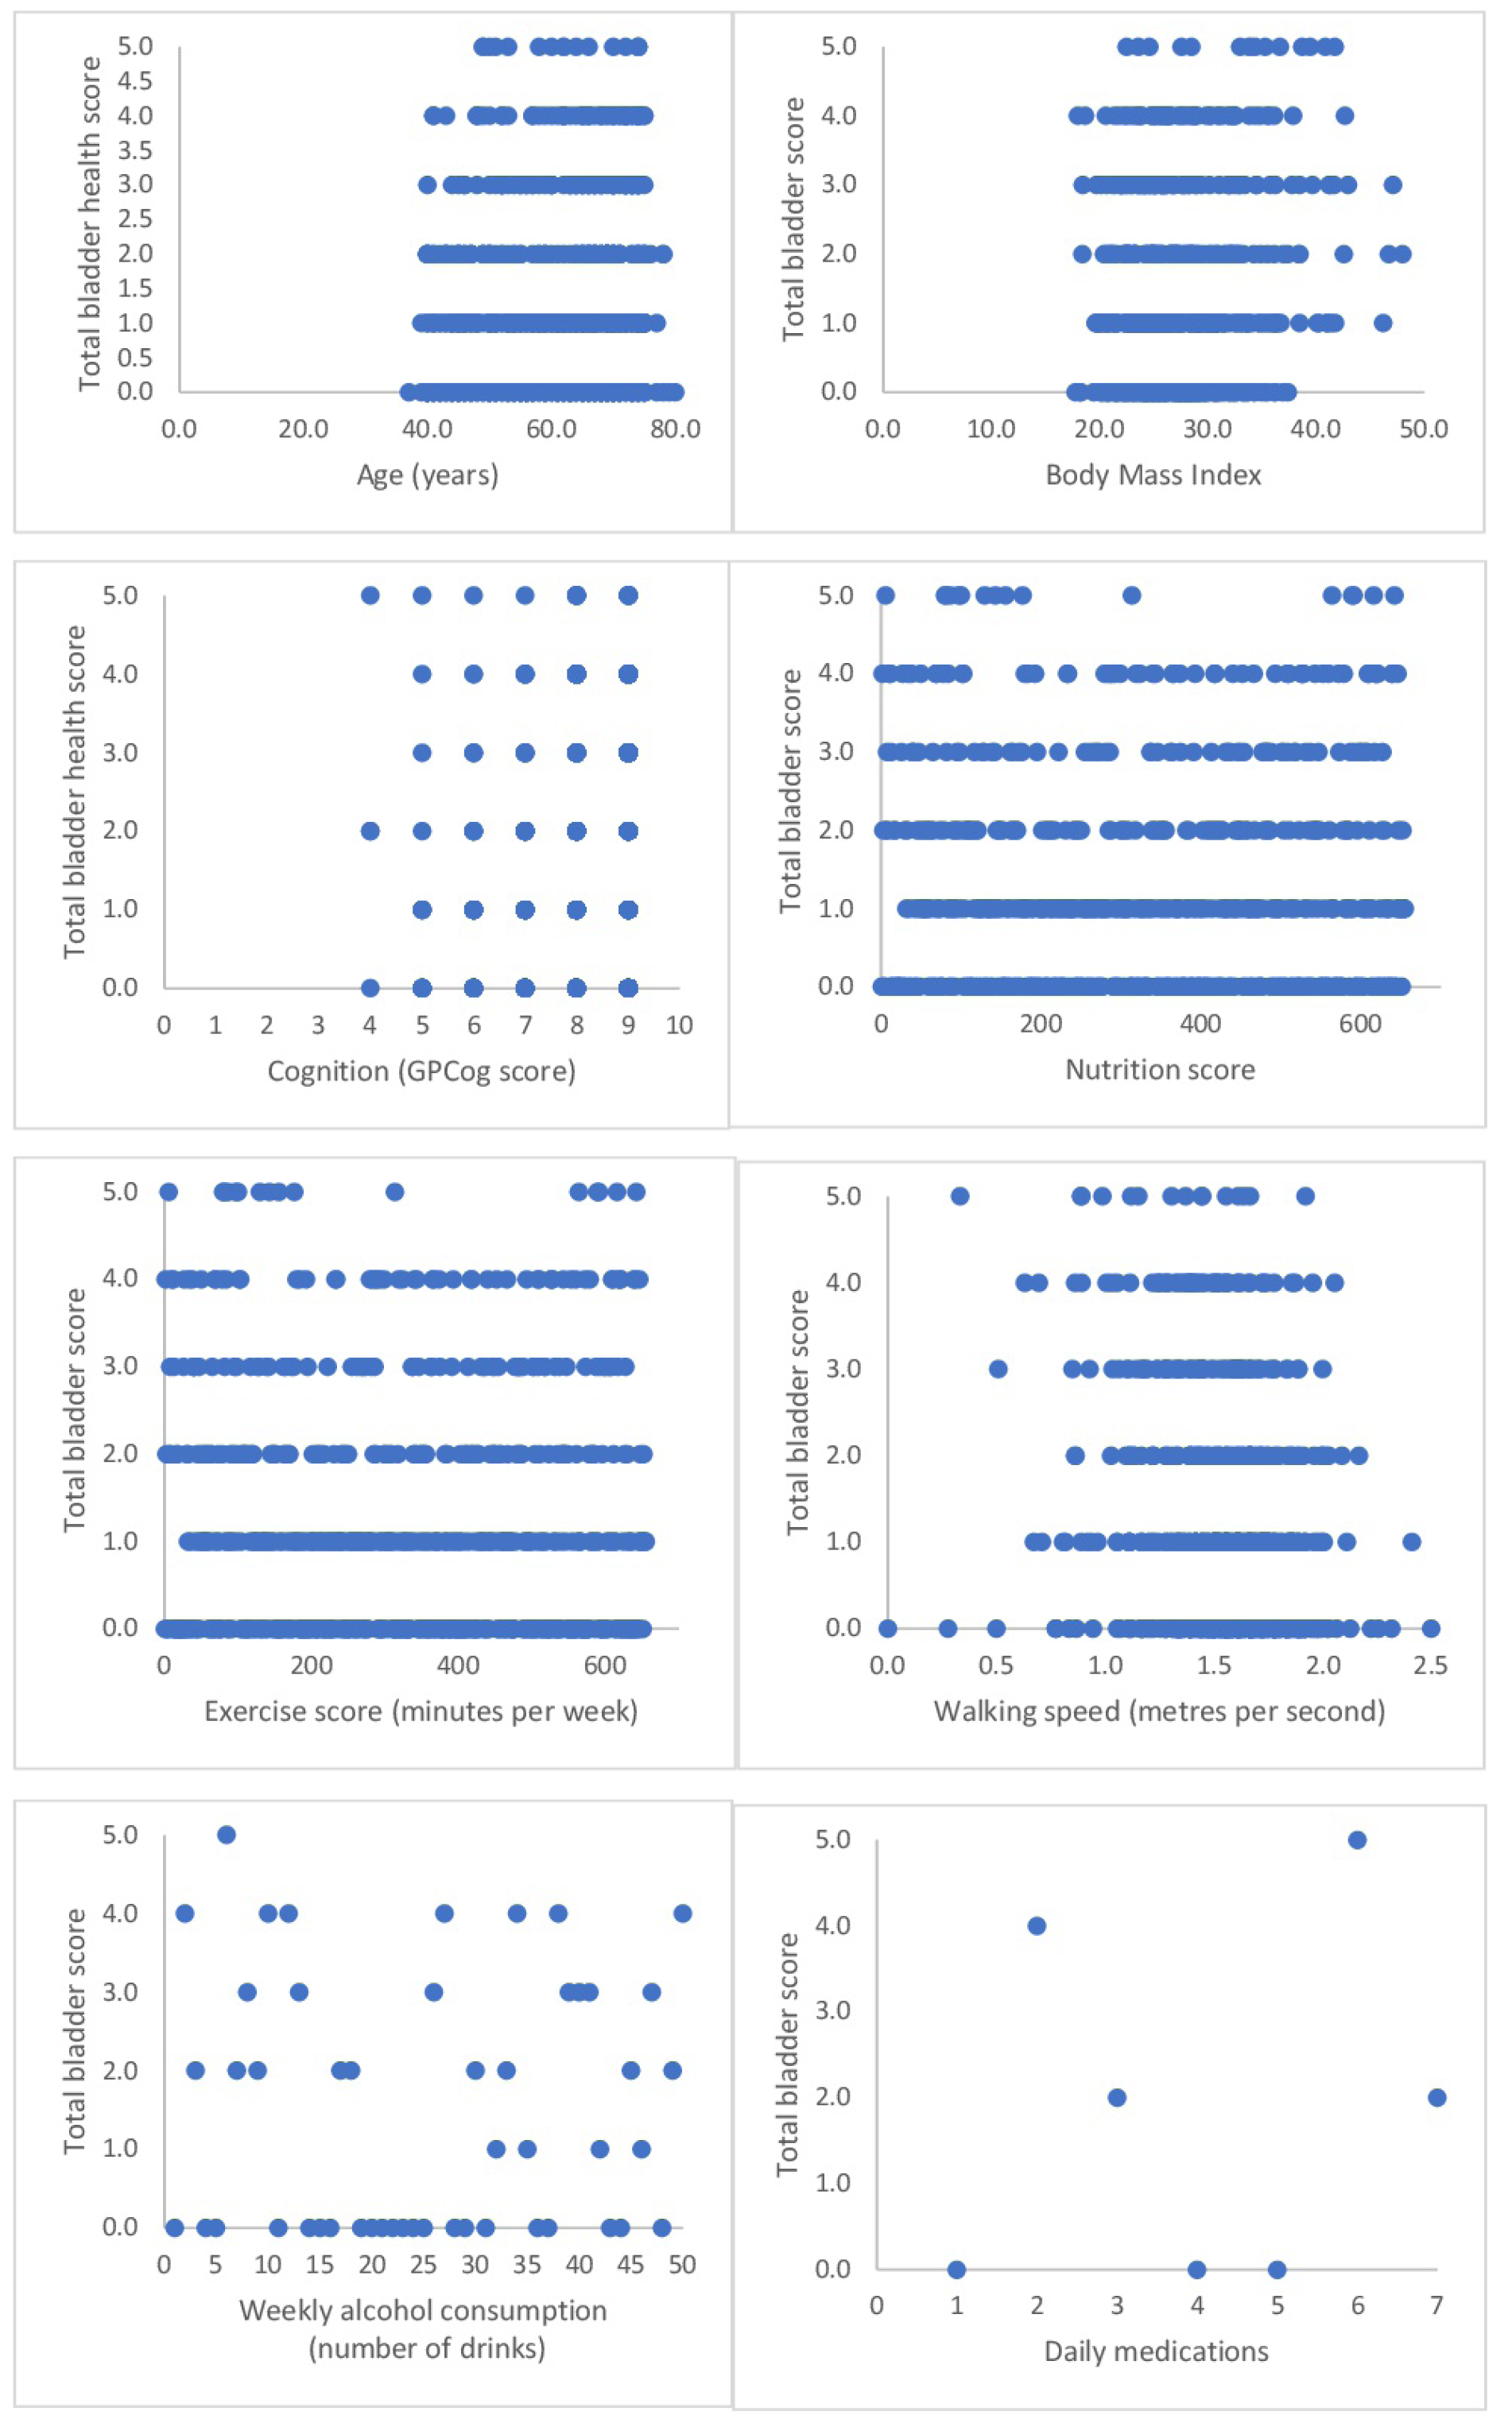
Figure 1. Scatter plots of the associations between bladder health and cognition, exercise, walking speed, alcohol consumption and polypharmacy
The scaled predictor variables for each of bladder health categories are described in Table 3. The percentage of subjects in each bladder health category with each level of categorical predictors is reported in Table 4. There were significant differences in proportions across categories for gender, individual health concerns, and regular medications.
Table 3. Mean predictor variable values for three categories of bladder health
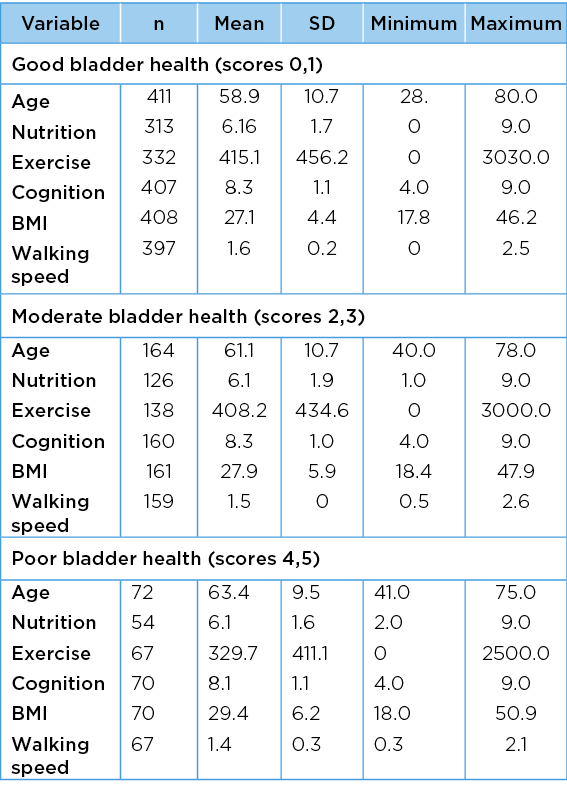
Legend: Unit measures: Age (years) , BMI (weight/height2) Cognition (GP COG score) Nutrition, Australian Dietary Guidelines Eat for Health24 score recommended number of serves of vegetables, legumes/beans and fruit per day, Exercise (minutes/day) , Walking speed (6MWT) minutes.
Table 4. Poor bladder health categorical predictors
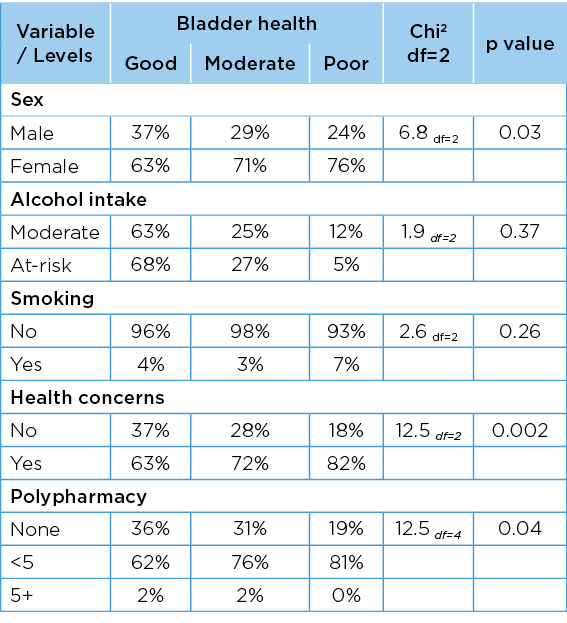
Legend: Unit measures: Health concerns Yes or No, Smoking Yes or No , Alcohol (standard drinks/week), Polypharmacy (measured as no regular medications, one to four regular medications, or more than five regular medications)
Crude and adjusted linear associations between the total bladder health score and scaled predictor variables are reported in Table 5. Older age, high BMI and slow walking speed were significantly associated with poor bladder health in both crude and adjusted models. After adjusting for gender and age, high BMI and poor walking speed explained variability in the total bladder health score (7% and 6% respectively). The associations between bladder health and other predictor variables became significant when gender and age were added to the models, indicating the importance of these two variables in understanding changes in bladder health.
Table 5. Associations between total bladder scores and continuous or integer predictor variables
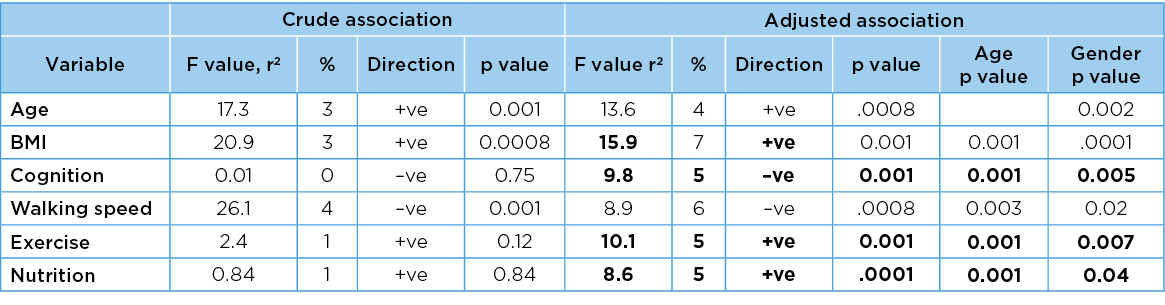
Significant findings are bolded.
For the integer factors, the positive direction of association is indicated as +ve and the negative direction of association is indicated as –ve.
Legend: Unit measures: Age (years) , BMI (weight/height2) Cognition (GP COG score) Nutrition, Australian Dietary Guidelines Eat for Health24 score recommended number of serves of vegetables, legumes/beans and fruit per day, Exercise (minutes/day), Walking speed (6MWT) minutes.
Differences between bladder health scores between the levels of the categorical variables are reported in Table 6. The only predictor variable with significant differences across bladder health categories was health concerns. Gender and age similarly exerted significant confounding influences on all associations.
Table 6. Association between total bladder scores and categorical predictor variables
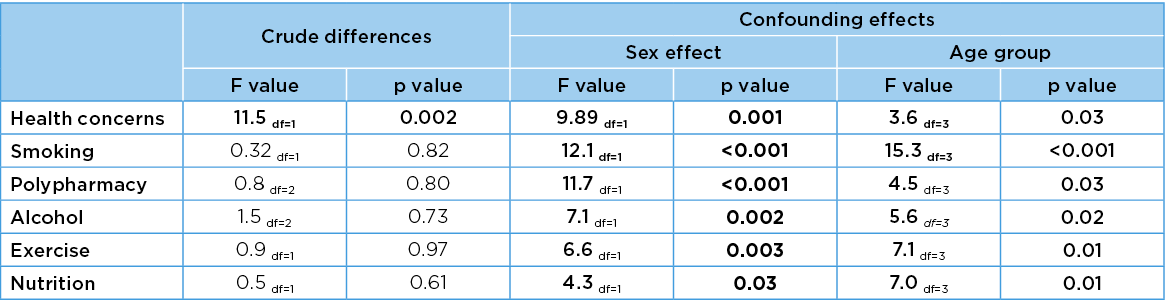
Legend: Unit measures: Health concerns Yes or No, Smoking Yes or No, Alcohol (standard drinks/week), Polypharmacy (measured as no regular medications, one to four regular medications, or more than five regular medications)
Important predictor variables such as BMI, walking speed and health concerns were significantly associated with each other. Higher BMI was strongly associated with slower walking speed (F=69.4, p<0.05, r2=10.1%). Both high BMI and slow walking speed were significantly different for people with, and without, health concerns (df=1) (F=15.6, p<0.05; F=20.5, p<0.05 respectively). Gender was significantly associated with the differences in walking speed related to health concerns, but not for BMI. Age was significantly associated with both BMI and walking speed related to health concerns. Mean differences in BMI and walking speed are reported in Table 7 for people with, and without, health concerns, in gender and age groups, highlighting the consistently higher values for BMI, and slower values for walking speed, for people with health concerns.
Table 7. Differences in integer predictor variables by health concerns, age and sex for total bladder score
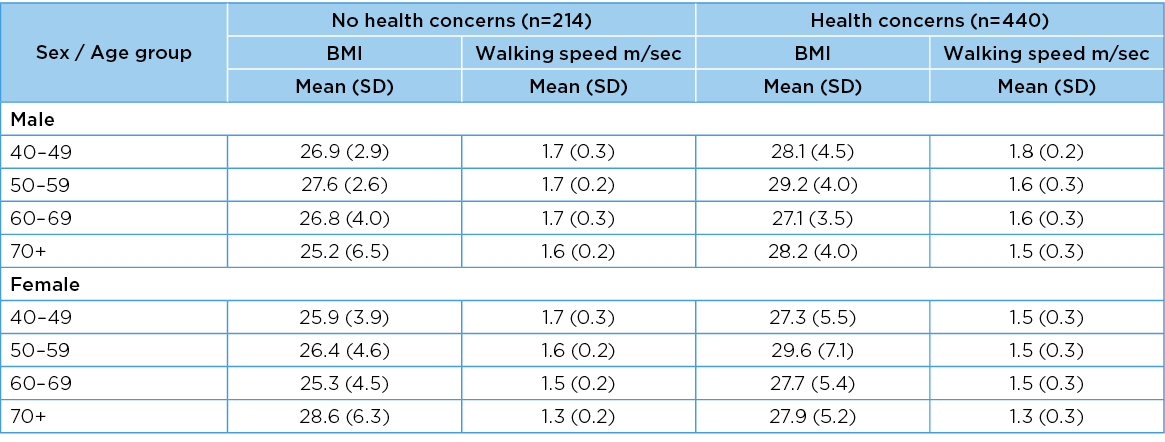
NB: Two participants did not report health concerns
Discussion
This study adds important information to current knowledge about bladder health in middle and older-aged Australian community-dwelling adults. Most research into incontinence in an Australian context has been conducted on people aged over 654, thus this paper provides rare support for the 2013 Australian Bureau Statistics findings that continence issues are a concern for many Australians over 40 years of age35.
Increasing age was associated with decreasing bladder health for both men and women, with women reporting significantly more problems than men in each age group. Regular physical activity has been reported as being associated with good physical and mental health12–18, and it is not surprising that we found that good physical health indicators were related to good bladder health. Walking speed is an indicator of physical fitness, and slower walking speeds were related to poor bladder health. The association between high BMI and poor bladder health is unsurprising as fitter people generally have lower BMI12–14. That people’s health concerns were also associated with poor bladder health concurs with current literature1,3,35.
Public health interventions for bladder health need to focus on variables related to lifestyle which are most amenable to change12–14,18,35. Three significant predictors (slower walking speed, higher BMI and health concerns) may be mutable to public health interventions to improve general health5,12,13,15,16,19. Improving walking speed, reducing BMI and addressing people’s health concerns may not only improve bladder health, but may also reduce risks of other chronic conditions such as hypertension, cardiac performance, obesity and falls risk.
Limitations
This study was limited in its capacity to draw causal inferences from the cross-sectional design, by the self-selected sample, and by difficulties in establishing a robust sample size in an unknown population. Whether increasing age, increasing BMI and decreasing walking speed are indeed related to decreasing bladder health should be tested in randomly selected samples from known community sources, followed over suitably lengthy periods of time. The log transformative process required adjusting the total bladder health score by 1 to avoid the issue of log transformation of 0. This may have inflated the model outputs, incurring Type 1 errors.
Public health implications
The significant age and gender effects persisted throughout the modelling process. This highlights the need for bladder health interventions to be relevant to men and women aged 40 years and older living independently in the community. Poor bladder health should not be an accepted part of growing older3–5. Community-based interventions targeting improved fitness and weight-loss, as well as education about general health and pelvic floor function, could have an added benefit by improving bladder health for people of all ages. With only 31% of people with urinary incontinence reported as seeking professional help35, the findings of this research highlight the importance of intervening in an issue that has high levels of under-reporting, misconception and high morbidity burden1,5,7,35.
Conclusion
Improving walking speed and BMI with non-gender-specific public health campaigns seem feasible to improve bladder health in community-dwelling adults over 40 years of age. People may find it challenging to speak to healthcare providers about poor bladder health, but it may be addressed by interventions to improve general health, increase physical activity and lose weight. Preventing poor bladder health is essential to reduce the predicted burden of ageing on Australia’s future healthcare system, and to safeguard individual good health now, and into the future.
Conflict of interest
The authors declare no conflicts of interest.
Funding
The authors received no funding for this study.
Author(s)
Susan Jayne Gordon*
Caring Futures Institute, College of Nursing and Health Sciences, Flinders University, Adelaide, SA, Australia
Email Sue.gordon@flinders.edu.au
Karen Anne Grimmer
College of Nursing and Health Sciences, Flinders University, SA, Australia
Division of Physiotherapy, Faculty of Medicine and Health Science, Stellenbosch University, Cape Town, South Africa
Nicky Baker
Caring Futures Institute, College of Nursing and Health Sciences, Flinders University, Adelaide, SA, Australia
References
- Johnson TM II, Kincade JE, Bernard SLG et al. The association of urinary incontinence with poor self-rated health. JAGS 1998;46(6):693–699.
- Pierce H, Perry L, Gallagher R, et al. Pelvic floor health: a concept analysis. JAN 2015;71(5):991–1004.
- Aoki Y, Brown HW, Brubaker L, et al. Urinary incontinence in women. Nature Rev Dis Primer 2017 Jul 6;3(1):1–20.
- Zeleke BM, Bell RJ, Billah B, et al. Symptomatic pelvic floor disorders in community-dwelling older Australian women. Maturitas 2016;85:34–41.
- Özdemır ÖC, Bakar Y, Özengın N, et al. The effect of parity on pelvic floor muscle strength and quality of life in women with urinary incontinence: a cross sectional study. J Phys Ther Sci 2015;27(7):2133–2137.
- Ko Y, Lin SJ, Salmon JW, et al. The impact of urinary incontinence on quality of life of the elderly. Am J Manage Care 2005;11(4Suppl):s103–s111.
- Charalambous S, Trantafylidis A. Impact of urinary incontinence on quality of life. Pelviperineol 2009;28:51–53.
- Ghetti C, Lee MJ, Oliphant S, et al. Sleep quality in women seeking care for pelvic organ prolapse. Maturitas 2015;80(2):155–161.
- Griebling TL. Urinary incontinence in the elderly. Clin Geriatr Med 2009;25(3):445–457.
- Keane DP, O’Sullivan S. Urinary incontinence: anatomy, physiology and pathophysiology. Best Pract Res Clin Obstet Gynaecol 2000;14(2):207–226.
- Gordon SJ, Grimmer KA, Baker N. Poor pelvic floor health in Australians aged 40 to 75 years. ANZ Cont J 2021;27(1):17–22.
- Dallosso HM, McGrother CG, Matthews RJ, the Leicestershire MRC Incontinence Study Group. The association of diet and other lifestyle factors with overactive bladder and stress incontinence: a longitudinal study in women. BJU 2003;92(1):69–77.
- Koskimaki J, Hakama M, Huhtala H, et al. Association of dietary elements and lower urinary tract symptoms. Scand J Urol Nephrol 2000;34:46–50.
- Nygaard IE, Shaw JM. Physical activity and the pelvic floor. Am J Obstet Gynecol 2016;214(2):164–171.
- Alnaif B, Drutz HP. The Association of smoking with vaginal flora, urinary tract infection, pelvic floor prolapse, and post-void residual volumes. J Lower Gen Tract Dis 2001;5(1):7–11.
- Bradley CS, Kennedy CM, Nygaard IE. Pelvic floor symptoms and lifestyle factors in older women. J Women’s Hlth 2005;14(2):128–36.
- Pomian A, Lisik W, Kosieradzki M, et al. Obesity and pelvic floor disorders: a review of the literature. Med Sci Monit 2016;22:1880–1886.
- Fornell EU, Wingren G, Kjølhede P. Factors associated with pelvic floor dysfunction with emphasis on urinary and fecal incontinence and genital prolapse: an epidemiological study. AOGS 2004;83(4):383–389.
- Gordon S, Grimmer K, Baker N, et al. Feasibility of population screening tests of establish a healthy ageing trajectory. SAGE Open Med 2019;7:1–9.
- Peterson TV, Karp DR, Aguilar VC, et al. Validation of a global pelvic floor symptom bother questionnaire. Int Urogynecol J 2010;21:1129–35.
- Abrams P, Andersson KE, Apostolidis AL, members of the committees. 6th International Consultation on Incontinence. Recommendations of the International Scientific Committee: evaluation and treatment of urinary incontinence, pelvic organ prolapse and faecal incontinence. Neurourol Urodyn 2018;37(7):2271–2272.
- Brodaty H, Pond D, Kemp NM, et al. The GPCOG: a new screening test for dementia designed for general practice. JAGS 2002;50(3):530–534.
- Canevelli M, Cesari, M, van Kan GA. Frailty and cognitive decline: how do they relate? Curr Opin Clin Nutr Metabol Care 2015;18(1):43–50.
- National Health and Medical Research Council (NHMRC). Australian dietary guidelines. Canberra (ACT): NHMRC; 2013. Available from: https://www.nhmrc.gov.au/guidelines-publications/n55.
- Australian Institute of Health and Welfare (AIHW). The active Australia survey: a guide and manual for implementation, analysis and reporting. Canberra: AIHW; 2003. ISBN:978 1 74024 258 5.
- National Health and Nutrition Examination Survey (NHANES). Anthropometry procedures manual. The National Institutes of Health, Centers for Disease Control and Prevention (CDC); 2017. Available from: http://www.cdc.gov/nchs/nhanes.htm/index.htm
- Chetta A, Zanini A, Pisi G, et al. Reference values for the 6-min walk test in healthy subjects 20–50 years old. Resp Med 2006;100(9):1573–1578.
- Steffen TM, Hacker TA, Mollinger L. Age- and gender-related test performance in community-dwelling elderly people: six-minute walk test, berg balance scale, timed up & go test, and gait speeds. Phys Ther 2002;82(2):128–137.
- Jenkins S, Cecins N, Camarri B, et al. Regression equations to predict 6 minute walk distance in middle-aged and elderly adults. Physio Ther Pract 2009;25(7):1–7.
- Tampakoudis P, Tantanassis T, Grimbizis G, et al. Cigarette smoking and urinary incontinence in women: a new calculative method of estimating the exposure to smoke. Eur J Obstet Gynecol Reprod Biol 1995;63(1):27–30.
- Masnoon N, Shakib S, Kalisch-Ellett L et al. What is polypharmacy? A systematic review of definitions. BMC Geriatr 2017;17(1):230.
- Ong GJ, Page A, Caughey G, et al. Clinician agreement and influence of medication-related characteristics on assessment of polypharmacy. Pharmacol Res Perspect 2017;5(3):e00321.
- National Health and Medical Research Council (NHMRC). Alcohol: Australian guidelines to reduce health risks from drinking alcohol. Canberra (ACT): NHMRC; 2019. Available from: https://www.nhmrc.gov.au/health-advice/alcohol
- Katz MH. Multivariable analysis: a practical guide for clinicians. 2nd ed. Cambridge: Cambridge University Press; 2006.
- Australian Institute of Health and Welfare (AIHW). Incontinence in Australia. Cat. no. DIS 61. Canberra: AIHW; 2013. Available from: https://www.aihw.gov.au/reports/disability/incontinence-in-australia/contents/table-of-contents
- Australian Bureau of Statistics. 3218.0 regional population growth, Australia, 2016–17. Canberra, Australia: ABS; 2018. Available from: https://www.abs.gov.au/AUSSTATS/abs@.nsf/Previousproducts/3218.0Media%20Release12016-17.
- Murphy A, Teplitsky S, Das AK, et al. Medical evaluation and management of male and female voiding dysfunction: a review. Rom J Intern Med 2019;1;57(3):220–232.