
Volume 24 Number 3
Optimising application of a two-layer compression bandage using continuous, multi-point sub-bandage pressure monitoring in healthy volunteers
Zachary J Verzwyvelt, Brian Fazzone, Pascual Jahuey, Andrew R Cameron, Darren P Burke, Leela S Zhuo,
Ella A Gerdes, Salvatore T Scali MD, Scott A Berceli, Scott T Robinson
Keywords venous leg ulcer, compression therapy, sub-bandage pressure
For referencing Verzwyvelt ZJ et al. Optimising application of a two-layer compression bandage using continuous, multi-point sub-bandage pressure monitoring in healthy volunteers. Journal of Wound Management 2023;24(3):87-94.
DOI
10.35279/jowm2023.24.03.06
Submitted 10 October 2023
Accepted 13 December 2023
Abstract
Compression therapy for the treatment of venous leg ulcers (VLUs) is often inconsistent due to variable practitioner competencies, patient pain tolerance and anatomy, as well as challenges adapting to varying material properties of the compression products used. A multi-point wireless pressure sensor (MPS) that longitudinally monitors pressure underneath a bandage provides a new means for surveillance of sub-bandage pressures. The MPS was used to measure sub-bandage pressure during and after the application of two-layer compression bandages on healthy volunteers. Live digital guidance improved the targeting of pre-specified sub-bandage pressures, from 31% using the manufacturer’s visual tension indicator to 85.7% when using digital guidance from an MPS positioned on the lateral side of the lower leg. Varying foot position during bandage application did not lead to a significant change in resting sub-bandage pressures. Regional variations in sub-bandage pressure were observed at different sensor locations, and a 23.5% mean decrease in static resting pressure was noted across all sensors 4 hours after the initial bandage application, with a steady state resting pressure reached after 90 minutes of wear time. The use of the MPS during and after bandage application offers real-time feedback that can facilitate interventions to improve the delivery of compression therapy.
Key messages
- Live digital guidance using sub-bandage pressure measurements improves the application of compression bandages.
- Regional variability in sub-bandage pressure is observed with multi-point pressure monitoring, which is related to local points of guidance for compression application.
- A reduction in sub-bandage pressure over time and with repeated bandage applications is observed with longitudinal monitoring.
Introduction
Compression therapy is the first-line treatment for venous leg ulcers (VLUs) and is recommended as a grade 1 clinical practice guideline supported by level A evidence1. The use of compression in the management of VLUs reduces lower extremity oedema and assists the calf muscle pump in overcoming valve reflux, increasing venous return and improving healing when compared to wound care without compression2–5.
Appropriate dosage of compression therapy via the achievement of consistent, targeted sub-bandage pressure is subject to a variety of factors, including practitioner competencies, patient pain tolerances, patient profiles, and material properties of the compression products used. Limb decongestion and oedema reduction can also significantly reduce sub-bandage pressure due to volume losses from fluid shifts, thereby diminishing the therapeutic benefit of an applied bandage over time.
Achieving and maintaining a targeted sub-bandage pressure is critical for the safe and effective treatment of VLUs, but applying reliable and consistent pressure can be a challenge. Under real-world conditions, experienced nurses may only achieve pressure within the target range in 15% or less of bandage applications6,7. Some compression garments offer physical indicators as a guide to the level of tension that should be delivered during compression application, such as a printed oval that deforms to a perfect circle under the recommended tension. Other more direct and quantitative methods have also been described, which consist of pneumatic pressure measurement devices comprised of a soft, inflatable probe that is tethered via tubing to a hand-held unit that inflates the probe, measures the resultant pressure, and displays the result8,9. These devices provide a limited window of pressure data at a single point underneath a bandage, making them less suitable for use in routine clinical practice.
More recently, alternative pressure measurement systems have been described that consist of flexible materials using piezoelectric or optical sensor mechanisms10. The ability to capture sub-bandage pressure at multiple points on a limb longitudinally after the application of compression allows evaluation of bandage performance and potentially can predict the efficacy of each treatment.
The objective of this study was to investigate how real-time pressure measurement can guide targeted application of compression therapy and monitor physiologic changes affecting bandage efficacy. We hypothesised that the use of continuous pressure monitoring with a multi-point pressure sensor (MPS) would allow us to 1) improve the ability to achieve sub-bandage pressures, 2) detect changes in sub-bandage pressure over time and 3) overcome pressure loss over time through bandage re-application after limb decongestion.
Methods
An observational study was performed on healthy volunteers where sub-bandage pressure was measured using a MPS during different bandage application strategies. We first compared static pressure measurements after bandage application using the manufacturer’s recommendation versus application with live feedback using the MPS. We then compared sub-bandage pressure measurements during application while varying foot position. Finally, we monitored changes in sub-bandage pressure over two consecutive 4-hour observation periods with interim re-application of the bandage.
Seven adult healthy volunteers were recruited for participation in this study. All compression testing was conducted using a two-layer compression system (Urgo Medical, UK), including a short-stretch inner layer and a long-stretch outer layer11,12. To aid guidance of targeted compression, visual stretch indicators are displayed on both bandage layers in the form of elongated ovals that stretch to form perfect circles under appropriate tension. This study was approved by the institutional review board at the University of Florida (Protocol IRB 202201787). All study procedures were carried out according to the Declaration of Helsinki and participants were fully informed about the research and informed consent was obtained.
A MPS (FeelTect Ltd, Ireland), was used for pressure measurements. The MPS device is comprised of a thin, flexible sensing arm (300mm length) with three sensor regions (22mm diameter) evenly spaced (90mm apart), which is positioned beneath the bandages. An electronics clip housing power, processing, storage and transmission components remains outside the bandage (Figure 1). Prior to the application of compression bandages, an elasticised tubular bandage (Tubigrip, Mölnlycke) was applied to the leg and an adhesive sheath, with inserted sensing arm, was adhered to the tubular bandage. The three sensor regions on each of the sensing arms were aligned longitudinally, with sensor levels corresponding to the B (above the ankle), B1 (where the calf muscle meets the Achilles tendon), and C (at the middle of the calf muscle) positions (Figure 1b). Reference pressure measurements were also taken at the posterior B1 position using a PicoPress probe (Microlab, Italy). Target pressures for each bandage application were 40mmHg at the B position, 40mmHg at the B1 position, and 30mmHg at the C position, in line with commonly accepted guidance suggesting graduated pressure with 40mmHg at the ankle graduated to 20mmHg below the knee13.
For each bandage application, MPS devices were placed medially and laterally on the leg. Bandages were applied to healthy volunteers using a) visual indicator guidance (VIG) in accordance with manufacturer’s instructions, b) medial digital guidance (MDG) using a medially placed MPS with a live readout for real-time monitoring by a provider during application or c) lateral digital guidance (LDG) using a laterally placed MPS for guided application. Pressure measurements were recorded by both a medial and lateral MPS simultaneously after bandage application. Therefore, for LDG, a medial MPS simultaneously recorded sub-bandage pressure, which the provider was blinded to and, for MDG a lateral MPS also recorded sub-bandage pressure. A Fisher’s exact test was used to determine statistically significant differences in the proportion of times a targeted pressure was achieved at each sensing position (i.e., within ±5mmHg).
Bandage application strategy was varied so that the bandage was applied to healthy volunteers with the foot in a) dorsiflexion position (DP), b) neutral position (NP) or c) a combination of DP until bandaging reaches the ankle, followed by NP for the remainder of application up the leg (combined position, CP) (Figure 1d). To validate the MPS against a known reference device, a PicoPress probe was placed posteriorly, level with the B1 position, and measurements were compared with a laterally placed MPS after bandage application under LDG.
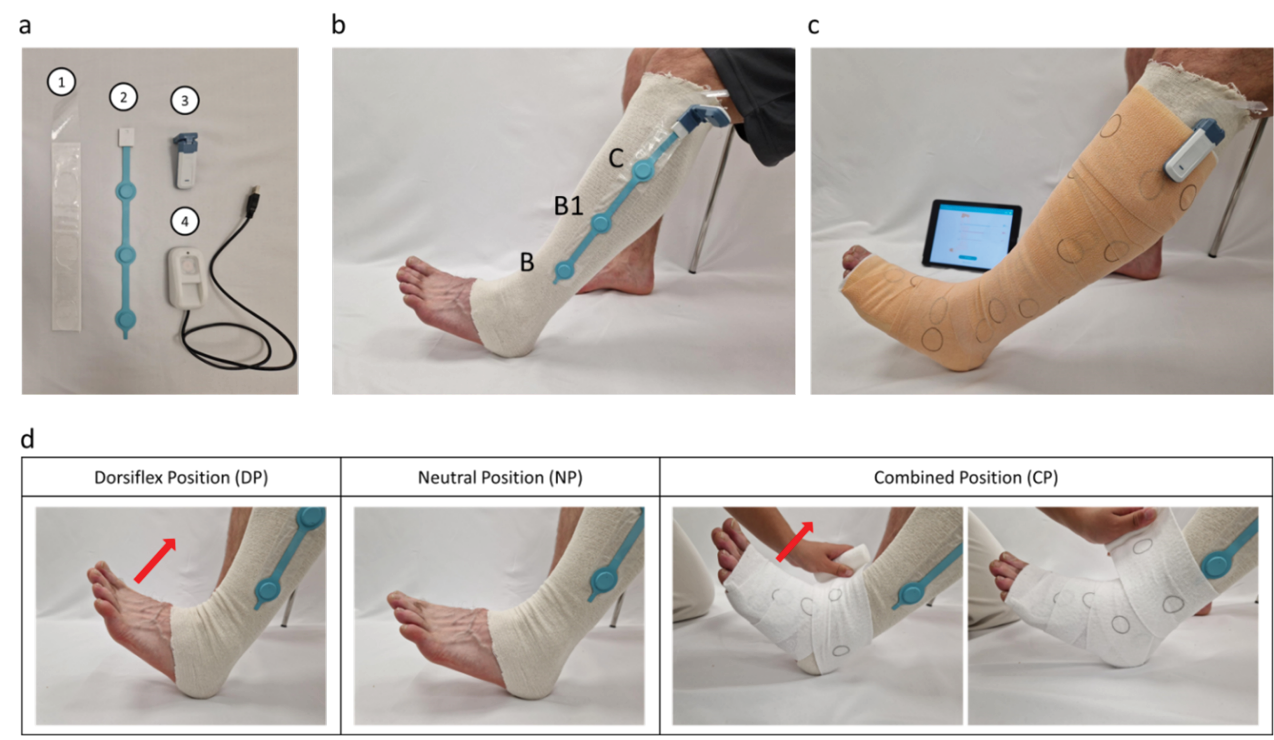
Figure 1. Application of a compression bandage with a MPS
a) The MPS consists of an adherent protective sheath (1) which houses the sensor arm (2) and attaches to the electronics clip (3). The device is powered through the clip which can be recharged (4)
b) The MPS sensor arm is positioned with a sensor each at the B, B1 and C positions
c) The bandage is applied so the electronics clip sits on the exterior of the bandage
d) Bandages were applied with the foot in DP, NP or CP, where the foot and ankle are wrapped while the foot is in DP but the calf is wrapped while the foot is in NP
To assess the ability to monitor pressure loss and the impact of bandage reapplication on the rate of pressure loss, LDG was used to apply bandages with pressure measurements recorded in a standing position over a 4-hour period at 30-minute intervals. After 4 hours, bandages were removed and immediately reapplied using LDG, with measurements repeated at 30-minute intervals for a further 4 hours (8 hours in total). Rates of pressure loss were compared between the first and second 4-hour blocks.
For pressure measurements, statistical significance between groups within each measurement position (i.e., B, B1 and C positions) was evaluated using one-way analysis of variance (ANOVA) with Tukey honestly significant difference (HSD) post hoc test. For comparisons of proportions of successful target applications achieved, Fisher’s exact test was used. All other pairwise comparisons used a Student’s t-test (two-tailed).
Results
Use of a MPS during bandage application to achieve target sub-bandage pressure
We first sought to determine if live visualisation of sub-bandage pressure could improve the ability to achieve desired target pressures at multiple points along the leg. Two-layer compression bandages were applied using three different guidance strategies while continuously measuring sub-bandage pressure from both a medial and lateral MPS. The bandage was first applied using VIG per manufacturer’s instructions, in which appropriate bandage tension is reached when ovals printed on the bandage reach a circular shape. The bandage was then applied using MDG with a continuous readout from a medial MPS providing feedback to the provider applying the bandage. Simultaneously, a lateral MPS measured pressure that the provider was blinded to. Lastly, the bandage was applied using LDG, with providers observing a continuous readout from the lateral MPS while blinded to data measured from a medial MPS.
As shown in Figure 2a, there was a higher proportion of successful applications recorded on the lateral MPS when using LDG (85.7%) than when using MDG (52.4%) or VIG (31.0%). Conversely, target pressures were achieved more frequently on the medial MPS when using MDG (85.1%) compared to LDG (31.0%) or VIG (42.9%). When combining readouts from both the medial and lateral sensors, target pressures were achieved at all sensor locations more frequently with LDG (58.3%) and MDG (69.1%) compared to VIG (36.9%). When using LDG, pressure measurements recorded by a lateral MPS were not statistically different to simultaneous posterior PicoPress measurements at the B1 position (Figure 2b), verifying the reliability and comparative similarity of the MPS pressure measurements.
Mean sub-bandage pressures after VIG were typically higher than target pressures on the laterally placed MPS at the B1 and C positions (Figure 2c), and higher on the medially placed MPS at the B position (Figure 2d). These data suggest digital guidance enables providers to achieve desired target pressures at specific locations, while use of the visual indicator can result in higher than predicted sub-bandage pressures. However, there is non-uniform circumferential pressure distribution with bandage application that results in regional variability in sub-bandage pressure.
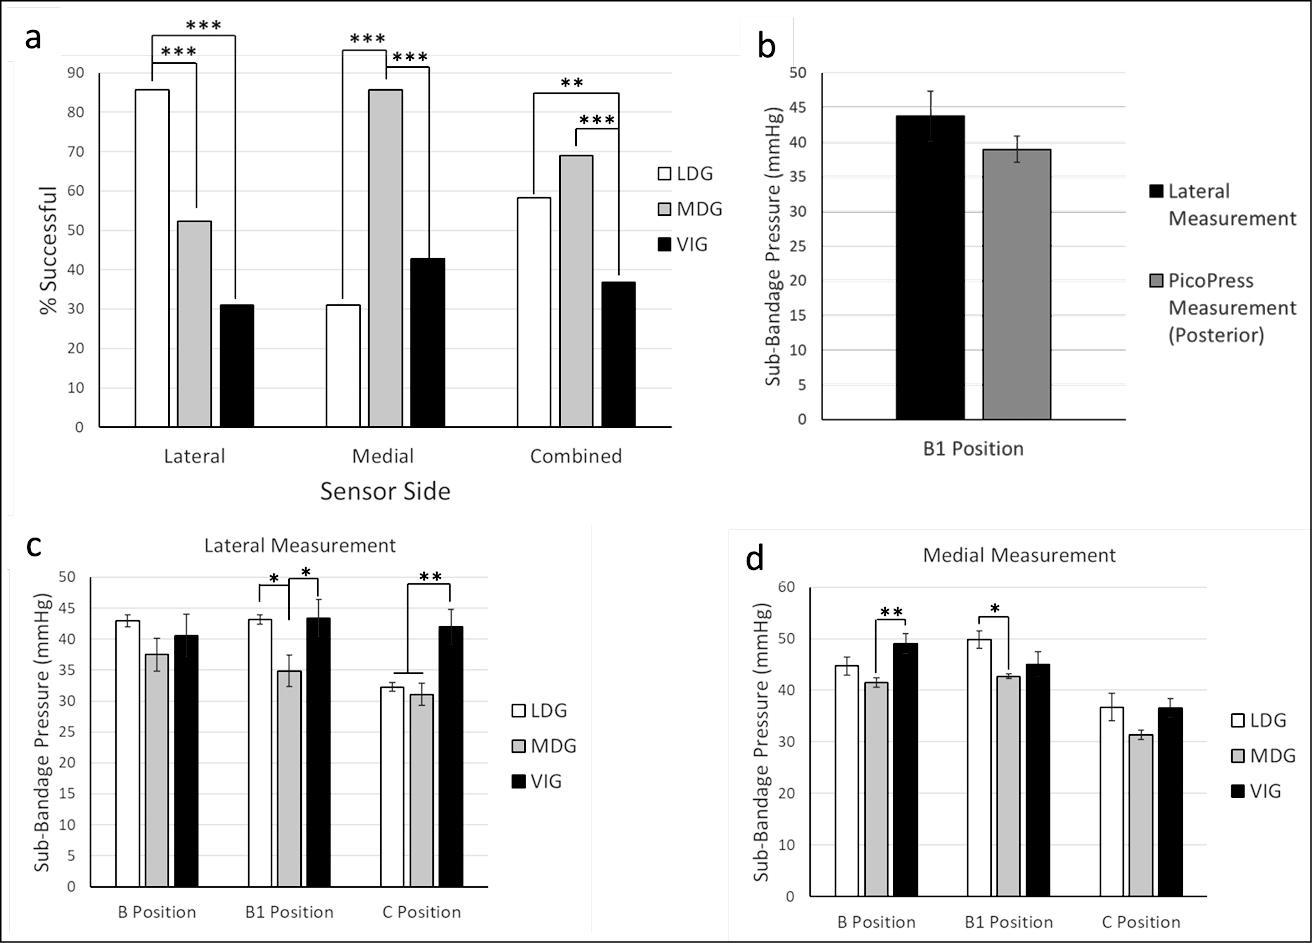
Figure 2. Comparison of sub-bandage pressures after different application strategies
a) The percentage of successful target pressures achieved were recorded at the lateral MPS, the medial MPS, or combined (lateral and medial) using LDG, MDG or VIG
b) Mean sub-bandage pressures were recorded from a posterior PicoPress or a lateral MPS at the B1 position when bandages were applied using VIG (no statistical difference observed)
c & d) Mean lateral (c) and medial (d) sub-bandage pressures were recorded with the MPS at three different positions when using different bandage guidance strategies
*p<0.05, **p<0.01, ***p<0.001
Effect of foot position during bandage application on sub-bandage pressure
We next examined the effect of foot position during bandage application on the resulting sub-bandage pressure. Bandages were applied using the LDG while sub-bandage pressure was measured by both a medial and lateral MPS. Lateral measurement demonstrated that target pressures of 40mmHg, 40mmHg and 30mmHg were effectively achieved (within ±5mmHg) in all cases at B, B1 and C positions, respectively (Figure 3). The higher measurements observed medially may be a result of the lateral guidance used during application. At each sensor position (B, B1 and C in both medial and lateral location) there was no difference in mean sub-bandage pressure when foot position was varied, suggesting that foot position during bandage application does not affect resultant sub-bandage pressure.
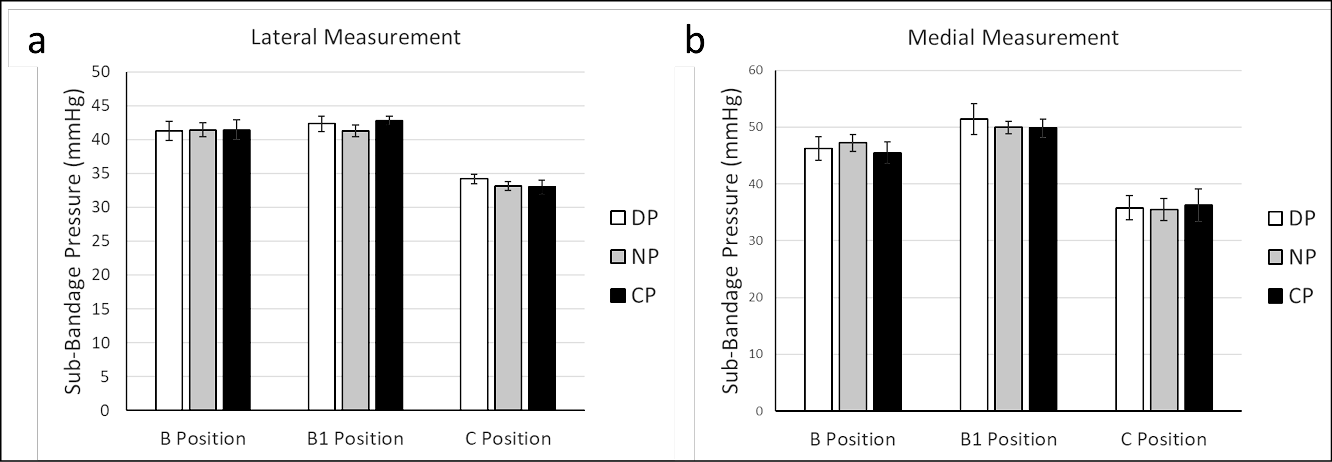
Figure 3. Bandage application with different foot positions. A LDG application technique was used to apply bandages with the foot in three different positions. Pressures were recorded from a lateral (a) and medial (b) MPS after bandage application with the foot in each positions
DP= dorsiflex position, NP= neutral position, CP= combined position (no statistical differences were observed within each measurement location)
Loss of sub-bandage pressure after bandage application
Lastly, we sought to monitor pressure changes over time using the MPS. We applied two-layer compression bandages using LDG and recorded sub-bandage pressure measurements from both a medial and lateral MPS over 4 hours. Participants were ambulatory and were able to sit, stand and walk ad libitum between measurements, although none of the participants engaged in any strenuous physical activity during the study period. The bandage was then removed, and a second bandage was immediately applied with LDG, and again pressure was recorded over 4 hours. As shown in Figures 4 and 5, there were significant reductions in pressure observed across the B, B1 and C positions, both medially and laterally over consecutive 4-hour time courses. Loss of pressure typically plateaued after approximately 90 minutes (Figure 4), with an average of 75.7% and 71.1% of all pressure loss occurring within the initial 90-minute period for the first and second 4-hour time courses, respectively. Early pressure loss may be due to either the material properties of the bandage itself or settling of the bandage after application. Alternatively, incomplete decongestion may occur with the first bandage application, with further oedema reduction occurring with a second bandage application.
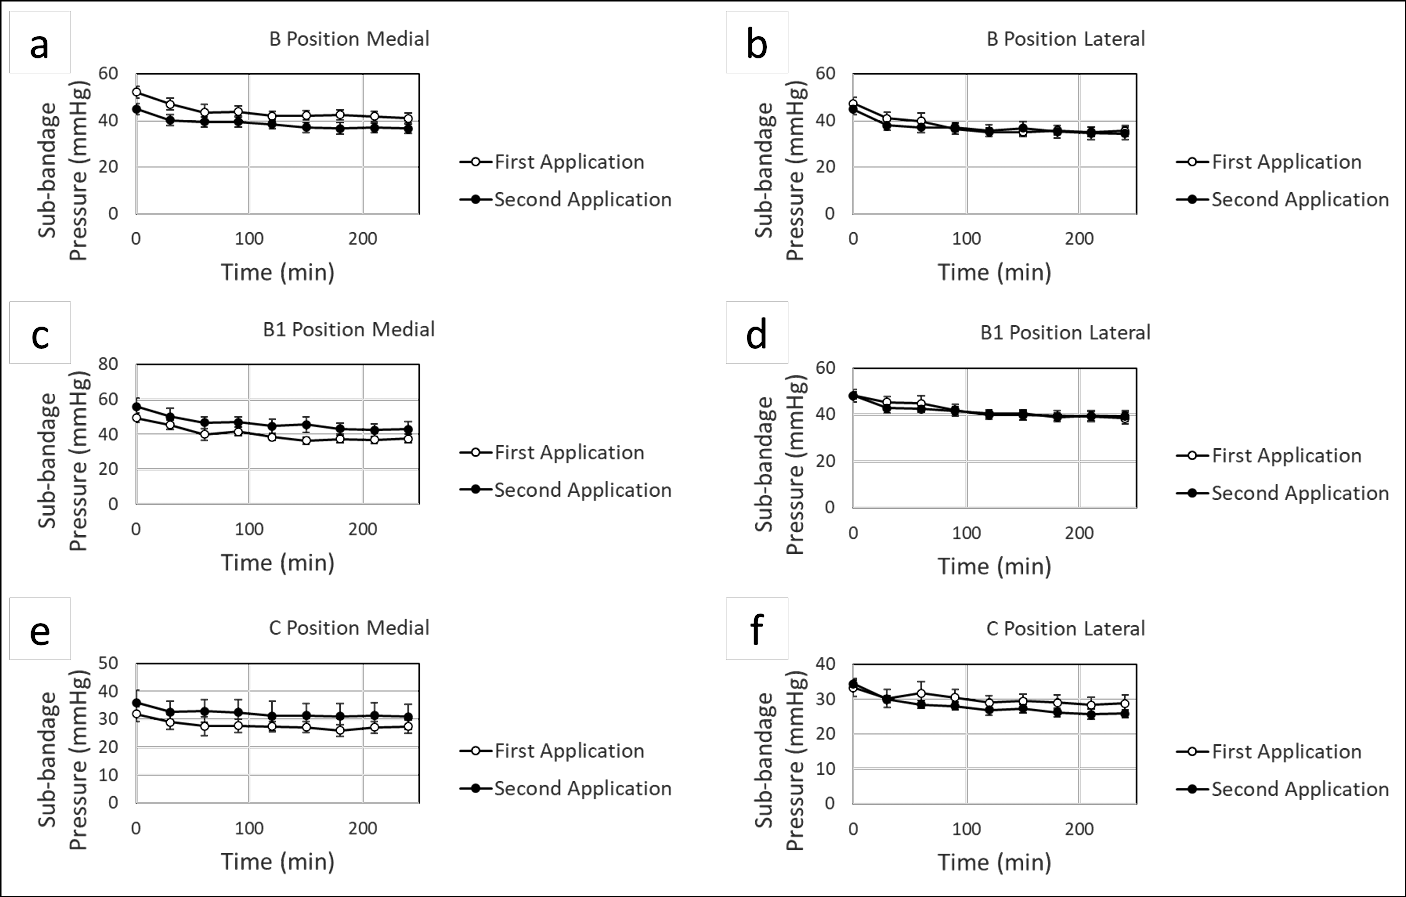
Figure 4. Continuous monitoring of sub-bandage pressure over time. Bandages were applied using LDG, and static measurements were recorded over 4 hours from a medial (a, c, e) and lateral (b, d, f) MPS with sensors at the B, B1 and C positions. After 4 hours, the bandage was removed, and a second bandage was immediately applied. Pressure measurements were again recorded over 4 hours
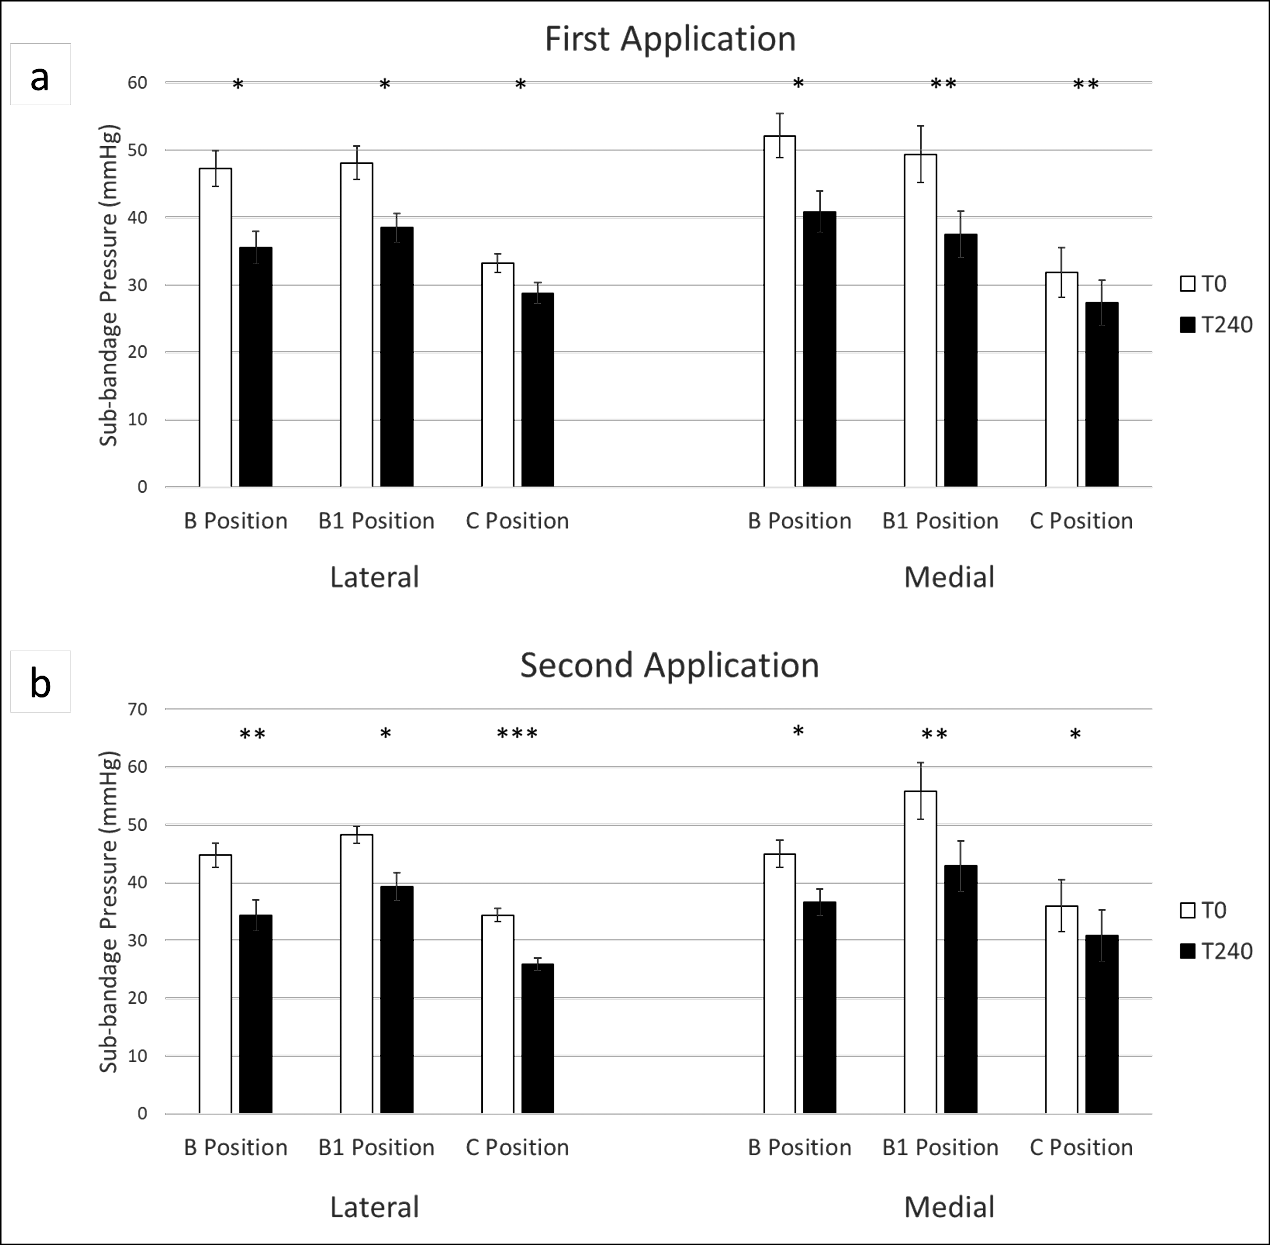
Figure 5. Changes in sub-bandage pressure after 4 hours. Sub-bandage pressures were recorded from a lateral and medial MPS after bandages were applied using LDG after 4 hours of wear time (a). The bandage was removed and a second bandage was immediately applied and pressure was recorded for another 4 hours (b)
*p<0.05, **p<0.01, ***p<0.001
Discussion
Since Conrad Jobst first introduced the concept of gradient compression stockings in 1951, compression therapy has been integral to the treatment of VLUs and chronic venous insufficiency14. Seventy years later, incremental advances in technology have led to modest improvements in the management of VLUs. In this study we explore the use of a new tool that provides insight into bandage performance through the capture of sub-bandage pressure measurements with remarkably high spatial and temporal resolution. The current study highlights opportunities for sub-bandage pressure monitoring to assist and improve the delivery of compression therapy using the MPS. The use of a simple pressure sensing device has the opportunity to radically alter how we deliver compression therapy through optimisation of existing clinical therapies.
Real-time pressure measurement was shown to guide targeted compression application at the B, B1 and C positions (i.e., 40mmHg, 40mmHg and 30mmHg, respectively), independent of foot positioning during the application. This could be useful in clinical settings given that, even in the hands of experienced practitioners who are performing compression on a daily basis, the use of pressure measurement guidance has been shown to improve targeted application15.
The potential for sub-bandage pressure monitoring to guide compression application was further demonstrated in the comparison of LDG, MDG and VIG compression application. Previous studies that include the measurement of sub-bandage pressure typically reference medial measurement in the B1 position, at the transition of the medial gastrocnemius muscle into the Achilles tendon, approximately 10–15cm proximal to the medial malleolus16. The results of the current study suggest that the use of digital guidance allows providers to achieve target pressures more frequently at the site of the sensor. However, regional variability was noted such that sub-bandage pressures at the side used for guidance were often different from values recorded at the opposite axial anatomic position. For example, during medial guidance (i.e., MDG), lateral pressure measurements were lower than when using lateral guidance (i.e., LDG) at the B1 position (Figure 2c). During lateral guidance (i.e., LDG), medial pressure measurements were higher than when using medial guidance (i.e., MDG) at the B1 position (Figure 2d). These subtle regional pressure variations may represent changes due to focal variations in leg morphology or slight variations in technique when using lateral vs. medial visual guidance as a result of a user’s preferred hand. In general, however, the differences in mean pressure measurement between MDG and LDG were small, and their clinical significance may be negligible.
There may also be practical reasons for assessing alternative positions of pressure measurement, such as the positioning of the wound and associated dressings, the design and positioning of seams, straps or other features of a compression product, accessibility during application, or interference with patients’ daily activities (e.g. walking) or ability to wear clothing. Targeting pressure by guiding compression application in the medial versus lateral position, particularly at the C position, was not statistically significant, suggesting guidance on either side could be appropriate, depending on consideration of other factors previously mentioned.
Use of the VIG with the UrgoKTwo System resulted in failure to achieve target pressures more frequently than either MDG or LDG, particularly at the B and C positions. However, average pressures achieved with VIG were generally comparable, if not slightly higher than the target pressures. Given that higher sub-bandage pressures have been shown to increase healing rates of VLUs17–20, it is possible that these applications would not negatively impact clinical outcomes. Furthermore, VIG enables similar achievement of target sub-bandage pressures when compared to measurements taken opposite from the digitally guided applications. For example, the success rate of target applications measured on the medial MPS was 42.9% using VIG compared to 31.0% using LDG. Thus, digital guidance using pressure sensors improves targeted application, but not necessarily in locations where sensors are absent or not used for guidance. The settling of pressures was also not assessed in this study, so it is possible that regional pressure differences could equalise over time.
Continuous digital pressure measurement also offers the ability to monitor the loss of pressure over time, as observed after 4 hours of bandage wear during this study. Significant losses of pressure were seen across all leg positions, particularly in the B and B1 positions. It was hypothesised that an initial loss of pressure could potentially be rescued through the reapplication of compression after 4 hours, once decongestion of leg oedema was achieved. Surprisingly, a similar pressure drop was observed in the second 4-hour period after reapplication of the bandage. Resting pressure stabilised at all sensor positions after the first 90 minutes of compression during both the first and second 4-hour bandage applications. While the initial plateau was expected, we did not anticipate that a reduction in pressure would be seen after the second bandage application. The reduction in sub-bandage pressure during the second application could be attributed to fatigue of the bandage material, settling of the bandage after application, or the need for a threshold level of pressure to achieve limb decongestion that is no longer met at the point of pressure plateauing.
In future studies it would be useful to assess the total, accumulative pressure reapplication required to maintain a constant pressure at a given target, whilst also comparing different compression products to assess the role of material and product-specific properties in pressure loss. The use of adjustable products, such as adjustable Velcro wraps, could be a means to achieve such a result. Results from the current study indicate that even when targeted pressures are achieved, a potential loss of functionality may occur within as little as 4 hours, with average losses of 23.5% and 24.5% observed across all positions for the first and second bandage applications, respectively. There is potential for further clinical benefits, such as oedema reduction, via one or more repeat applications of compression within a short period of time.
Limitations of this study include its relatively small sample size and limited number of providers applying bandages. Additionally, bandages were only applied on healthy volunteers with presumably normal venous function. Different trends may be noted on patients with significant oedema, venous outflow obstruction or valvular incompetence. In future studies, we intend to understand pressure variation in patients with active VLUs.
Conclusion
Compression therapy is a pivotal form of treatment in conditions related to venous or lymphatic insufficiency. Therapeutic compression needs to be carefully balanced with safety and comfort to the patient, with sub-bandage pressure providing a potential quantifiable measure for delivering controlled doses of compression therapy. In the current study, a novel wearable pressure sensing device and digital platform was used to guide targeted application of compression therapy at defined pressures for the B, B1 and C positions on the medial and lateral sides. Foot position was shown not to have a significant impact on applied pressures, while MDG and LDG of compression application (i.e., using the wearable pressure sensing device) was shown to achieve a higher proportion of target pressure applications than visual indicators on the compression product. Significant losses of pressure were measured over a short period of time (4 hours), with an immediate reapplication of compression showing equivalent behaviour within a second 4-hour period.
When VIG was used during bandage application, sub-bandage pressure was less frequently within the target range than when digital guidance was used. Since mean sub-bandage pressures were similar regardless of application strategy, utilising the VIG provides a safe method for clinicians to apply a clinically appropriate level of compression. However, digital guidance offers several advantages over the use of VIG. If patients are unable to tolerate standard doses of compression and there is a need for a reduced compression pressure or a gradual build-up over time, this would be difficult to achieve using VIG but could be easily accounted for using digital guidance, presenting the opportunity for tailored treatment regimens.
Real-time, longitudinal, multi-point monitoring of sub-bandage pressure can inform the adequacy of compression application in healthy volunteers. These results highlight significant opportunities for the monitoring of compression therapy in routine clinical practice to improve the application, maintenance and optimisation of a critical treatment (compression therapy) for wound and lymphoedema patients.
Implications for Clinical Practice
- The use of a digital multi-point pressure monitor provides valuable insight that can augment the delivery of compression therapy.
- Live, multi-point sub-bandage pressure monitoring can be used to achieve target sub-bandage pressures during bandage application.
- Regional sub-bandage pressure variation was observed using a multi-point pressure monitor, but the clinical significance of this phenomenon is unknown.
Further research
Understanding the physiological and clinical relevance of fluctuations and temporal trends in regional sub-bandage pressure is needed to improve performance of compression bandages.
Conflict of interest and funding
STR received funding from the American Venous Forum for this study. ARC and DPB are employees of FeelTect, Ltd. ARC, DPB and STR are co-inventors on a patent relating to the MPS technology.
Author(s)
Zachary J Verzwyvelt1 BS, Brian Fazzone1 MD, Pascual Jahuey1 BS, Andrew R Cameron2 PhD, Darren P Burke2 PhD, Leela S Zhuo3,
Ella A Gerdes3, Salvatore T Scali1,4 MD, Scott A Berceli1,4 MD PhD, Scott T Robinson*1,4 MD PhD
1Department of Surgery, University of Florida, USA
2FeelTect Limited, Galway, Ireland
3College of Engineering, University of Florida, USA
4North Florida/South Georgia Veterans Health System, USA
*Corresponding author email scott.robinson@surgery.ufl.edu
References
- O’Donnell TF, Passman MA, Marston WA, Ennis WJ, Dalsing M, Kistner RL, et al. Management of venous leg ulcers: clinical practice guidelines of the Society for Vascular Surgery® and the American Venous Forum. J Vasc Surg 2014;60:3S–59S. doi:10.1016/j.jvs.2014.04.049
- Wong IKY, Andriessen A, Charles HE, Thompson D, Lee DTF, So WKW, et al. Randomized controlled trial comparing treatment outcome of two compression bandaging systems and standard care without compression in patients with venous leg ulcers. J Eur Acad Dermatol Venereol 2012;26:102–10.
- Rubin JR, Alexander J, Plecha EJ, Marman C. Unna’s boot vs polyurethane foam dressings for the treatment of venous ulceration: a randomized prospective study. Arch Surg 1990;125:489–90.
- Morrell CJ, Walters SJ, Dixon S, Collins KA, Brereton LML, Peters J, et al. Cost effectiveness of community leg ulcer clinics: randomised controlled trial. Br Med J 1998;316:1487–91.
- Eriksson G, Eklund AE, Liden S, Zetterquist S. Comparison of different treatments of venous leg ulcers: a controlled study using stereophotogrammetry. Curr Ther Res Clin Exp 1984:678–84.
- Tidhar D, Keren E, Brandin G, Yogev M, Armer JM. Effectiveness of compression bandaging education for wound care nurses. J Wound Care 2017;26:625–31.
- Heyer K, Protz K, Augustin M. Compression therapy – cross-sectional observational survey about knowledge and practical treatment of specialised and non-specialised nurses and therapists. Int Wound J 2017;14:1148–53. Available from: https://pubmed.ncbi.nlm.nih.gov/28744967/
- Nandasiri GK, Shahidi AM, Dias T. Study of three interface pressure measurement systems used in the treatment of venous disease. Sensors (Switzerland) 2020;20:1–13.
- Partsch H, Mosti G. Comparison of three portable instruments to measure compression pressure. Int Angiol 2010;29:426–30.
- Kruanopparat R. Pressure-measuring devices for compression therapy in venous leg ulcers: a comprehensive review. Adv Skin Wound Care 2021;34:1–6.
- Benigni JP, Lazareth I, Parpex P, Gerard JL, Alves M, Vin F, et al. Efficacy, safety and acceptability of a new two-layer bandage system for venous leg ulcers. J Wound Care 2007;16:385–90.
- Jünger M, Ladwig A, Bohbot S, Haase H. Comparison of interface pressures of three compression bandaging systems used on healthy volunteers. J Wound Care 2009;18:474, 476–80.
- Schuren J, Mohr K. Pascal’s law and the dynamics of compression therapy: a study on healthy volunteers. Int Angiol 2010;29:431–5.
- Burgdorf WHC, Muscarella VA, Hoenig LJ. Conrad Jobst: great inventor and stocking maker. JAMA Dermatol 2015;151:1243.
- Hafner J, Lüthi W, Hänssle H, Kammerlander G, Burg G. Instruction of compression therapy by means of interface pressure measurement. Dermatol Surg 2000;26:481–8.
- Partsch H, Clark M, Bassez S, Benigni J-P, Becker F, Blazek V, et al. Measurement of lower leg compression in vivo: recommendations for the performance of measurements of interface pressure and stiffness: consensus statement. Dermatol Surg 2006;32:224–32; discussion 233.
- Karanikolic V, Binic I, Jovanovic D, Golubovic M, Golubovic I, Djindjic N, Petrovic D. The effect of age and compression strength on venous leg ulcer healing. Phlebol 2018 Oct;33(9):618–626. doi:10.1177/0268355517749112.
- Milic DJ, Zivic SS, Bogdanovic DC, Jovanovic MM, Jankovic RJ, Milosevic ZD, et al. The influence of different sub-bandage pressure values on venous leg ulcers healing when treated with compression therapy. J Vasc Surg 2010;51:655–61.
- Karanikolic, Golubovic M, Stevanovic G, Jankovic I, Karanikolic A. The influence of compression strength and patient and wound variables on venous leg ulcers healing. Dermatologica Sinica 2019;37:194. Available from: https://www.dermsinica.org/article.asp?issn=1027-8117;year=2019;volume=37;issue=4;spage=194;epage=198;aulast=Karanikolic
- Karanikolic V, Ignjatovic A, Marinkovic M, Djordjevic L. The effectiveness of two different sub-bandage pressure values on healing and quality of life outcomes for patients with venous leg ulcers. Postepy Dermatol Alergol 2023;40:47–53.