Volume 24 Number 2
Body shape: a predictor for pressure injury risk
Ann Marie Dunk and Anne Gardner
Keywords Body mass index, body shape, pressure injury, Waterlow Risk Assessment, weight.
Abstract
Aim: This study explored the visual anatomical characteristics of the buttock region through use of an interface pressure mapping system to determine the correlation of shape with selected risk factors.
Background: Pressure injuries are a major challenge for health care systems worldwide. Risk assessment tools are limited in predicting pressure injury. Interface pressure mapping systems can potentially map body shape data related to pressure injury risk.
Methods: This work was nested within a larger exploratory study which utilised a randomised controlled design. One hundred and twenty-six patients were recruited at any time during their admission to a public tertiary referral hospital or a community hospital. Equipment including the designated standard hospital mattress and bed, and the Tekscan ClinseatTM pressure mapping system was used to explore the visual anatomical characteristics of patients’ buttock region and the correlation of shape with selected risk factors. Demographic and Waterlow Risk Assessment Tool data were collected.
Results: Five buttock shapes were observed using the interface pressure mapping surface, then categorised into ‘round/square’ and ‘other’ groups. Round and square shapes were significantly associated with higher body mass index and Waterlow Risk Assessment scores.
Conclusions: Visually assessing buttock shape demonstrates potential for identifying pressure injury risk in this region.
Introduction
Pressure injuries have been recognised as a worldwide patient safety problem and as a major challenge for health care professionals and health care systems1. Whilst the total number of Australians living with a pressure injury is unknown, Hibbs2 describes this as an epidemic but “a silent one hidden under the sheets”2, with many pressure injuries “not only unseen but also untreated, unrecorded and uncosted”2. Moreover, a large percentage of pressure injuries are considered to be preventable3,4. Pressure injuries have been assessed as extending the length of hospital stay for affected patients, impacting on hospital bed availability and reducing overall hospital efficiencies. Graves, Birrell and Whitby5 stated that pressure injury can increase a patient’s time in hospital between 7 and 50 days, and estimated that 398,432 bed days were lost between 2001 and 2002, incurring opportunity costs of A$285 million in Australian public hospitals. Within the United Kingdom, the cost of healing a Category 4 pressure injury has been determined to be up to £14,7716.
Apart from the financial impact on the health system, and the operational impact on individual hospitals, pressure injuries have a very real and negative impact on wellbeing for7 both sufferers and care-givers8,9. Indeed, Hietanen10 has suggested that it is easy for patients with pressure injuries to feel that they are hostage to the injury. The identification of patients considered at risk of pressure injury development and the implementation of prevention strategies is crucial not only to reduce human suffering but also to contain health care costs.
Background
Body shape is of increasing interest to researchers as an indicator of risk, although focussed research has been limited. Interest to date ranges from the potential to link posture to interface pressure in seated patients11,12 through to general use as an indicator of overall health status and how changes in shape may influence disease risk13. Swain and Bader14 suggested that loss of muscle tone in at-risk patients will result in a change of body shape. Defloor15 acknowledged body build as a pressure injury risk factor.
Body shape has been found to have an effect on interface pressure, as shape is affected by skeletal structure, the musculature structure including muscle tone, and the amount of subcutaneous fat14. Lindan and Greenway16 showed that obese patients had greater areas of increased pressure but lower peak interface pressures. The same study showed higher peak interface pressures were recorded with cachectic patients when compared with those of normal weight. Swain and Bader14 reported, however, that no link has been discerned between weight and interface pressure, or between body mass index (BMI) and interface pressure. Further research into the area of the relationship between shape, body type and interface pressure is therefore required. This study begins to address that gap.
This study aims to explore the visual anatomical characteristics of patients’ buttock region through the use of an interface pressure mapping system and to determine the correlation of shape with selected risk factors.
Method
Design and materials
This work was nested within a larger exploratory study entitled the Mapping Intervention for Prevention of Pressure Injury (MIPPI) project17. The MIPPI data were utilised for this study to investigate the visual anatomical characteristics of patients and the correlation between shape and selected risk factors for pressure injury.
The pressure injury risk factors were weight, BMI, and the risk scores as determined by the Waterlow Risk Assessment Tool18. The interface pressure mapping indices were peak interface pressure and the pressure gradient, measured at 1.5 cm and 2.5 cm from the point of peak interface pressure.
Participants
Further information on participant recruitment can be found in a recently published paper by the authors19. In brief, the sample for the study was drawn from medical and surgical clinical areas in a 450-bed public tertiary referral hospital and a 300-bed community hospital in the same town. This mix of clinical areas enabled recruitment of patients with a range of conditions, including those who were acutely and chronically ill.
Sample. The original sample size was determined by the requirements of the MIPPI project, for which the final sample size was 126. A sample size calculation was undertaken for the nested study and demonstrated that a sample of 119 would have a 90% power at the 0.001 significance level to detect a Pearson’s correlation coefficient of 0.4. This meant that there was ample power in the study to detect larger correlation coefficients even with non-normally distributed data20.
Patient identification and recruitment. The MIPPI project was advertised within each hospital, with posters describing the study located in the corridors in clinical areas. The clinical nurses in each area made patients aware of the opportunity to participate in the study and on request provided patients with an information sheet describing the project.
Patients were recruited into the project at any time during their admission to the nominated clinical areas. In addition, any patients who transferred into clinical areas where the study was taking place were approached to determine their willingness to participate.
Inclusion and exclusion criteria. The main inclusion criteria for this study were patients who were: 1) sixteen years and older; 2) identified as an inpatient and occupied a bed; and 3) who had either no pressure injuries or were identified as having a pressure injury on the sacral region which did not exceed Stage 1 as defined by national guidelines current at the time of the study21.
Patients less than 16 years of age were excluded from the study as the Waterlow Risk Assessment Tool has not been designed for use in paediatrics. In addition, four other exclusion criteria were applied, namely: 1) patients who did not consent to participate; 2) patients identified by nursing staff as requiring a high dependency of care with constant observation; 3) patients who could not tolerate lying supine with a 30% head elevation (two pillows); and 4) those who could not lie completely still for the length of time required for data collection.
Procedure
A combination of equipment, paper clinical tools, computer-generated data and software analysis tools were utilised for this study.
Equipment. The major equipment employed during the study comprised the designated standard hospital mattress and hospital bed, and the Tekscan ClinseatTM pressure mapping system. A designated study mattress was used to ensure standardisation of the data collection processes and consistency of study equipment as it was impossible to accurately assess the age of mattresses already circulating within the hospital system. The potential for the project results to be influenced by mattress age and condition was therefore removed.
The mattress was the Comfort PlusTM, the standard mattress used in the ACT hospitals at the time of the study. The mattress was developed by Australian Healthcare Industries and was made from high-quality foam with a convoluted foam egg shell shape, designed to reduce pressure and to lower shearing mechanisms. This mattress had been recommended by the company to be used for patients identified at low risk of pressure injury. The company did not provide any definition of low risk, nor any specific Waterlow score that equated with low risk of pressure injury development. The determination of low risk provided by Waterlow as being less than 10 was therefore used. Ethical considerations associated with the placement of at-risk patients on this mattress were covered in ethics approvals.
The designated study mattress was transported on a dedicated hospital bed which, therefore, ensured consistency of the surface on which the mattress was placed. In addition, the use of a hospital bed ensured that the bed was easy to move within the hospital environment and to maintain compliance with occupational health and safety requirements.
Additional equipment utilised within the study was the Tekscan ClinSeatTM interface pressure mapping system22, which comprised the Microsoft WindowsTM-based ClinSeatTM software loaded onto a dedicated laptop computer, a sensor mat, parallel interface module and the Tekscan handle22.
The ClinSeatTM sensor mat (53 cm x 49 cm) consisted of approximately 2,000 individual pressure sensing locations, referred to as “sensing elements” or “sensels”. The sensels were arranged in rows and columns on the sensor mat and uniformly placed at 1 cm intervals. Each sensel could be seen as an individual square on the computer screen when the 2D Contours View as described below was selected. The digital output of each sensel was divided into 256 increments, and displayed as a value (raw sum) in the range of 0–255 by the software. For presentation purposes, the ClinSeatTM software divided the mat into four quadrants.
Data from the sensor mat was collected via the Tekscan handle and provided to the ClinSeatTM software via the parallel interface module. Interface pressure information could be viewed as an image or as actual pressure values. A Dell laptop was used concurrently with the sensor mat to provide a visual display. A description of the software output is provided in the section addressing computer-generated data.
Clinical tools. A data collection tool was designed and utilised to record demographic data taken from the patient and extracted from the clinical notes. This component was designed by the MIPPI investigating team and validated in a pilot study. The design of the paper-based form matched the computer screen of the electronic data base to minimise the potential for transcription errors. The clinical parameters used for this study were recorded on the tool and included weight and height from which BMI was calculated later.
The Waterlow Risk Assessment Tool was the standard risk assessment tool in use in participating hospitals and has been utilised for this study, with the purpose of identifying individuals at risk of developing a pressure injury through the systematic assessment of the patient for identified risk factors23. The Waterlow Risk Assessment Tool is a multivariable tool that assesses the patient according to pre-defined demographic, health and behavioural factors to determine a risk score24,25. The variables used are weight and build, continence, skin type, mobility, gender and age, and appetite, and includes the consideration of special risks associated with tissue malnutrition, neurological deficits, surgery/trauma, and special medications. These categories enable the scorer to complete a detailed clinical assessment of the patient26. The Waterlow scale provides weighted scores in several categories, and also allows multiple scores in a number of categories, with the total score reflecting the overall risk level. A patient with a score 10 or greater is considered at risk. A score greater than 15 assesses the patient at high risk and greater than 20 at very high risk. The minimum possible score is 1 and the maximum score is 64. For the purposes of this study, patients were identified at risk with scores of 10 and above.
Computer-generated data. The Tekscan ClinSeatTM system generated data over a user-selected period at one-minute intervals for 10 minutes. The results of each measurement were a complete pressure map of the interface pressure across the sensor mat. The Clinseat™ system provided a variety of ways in which to view the results of measured interface pressure data, including a 2D (two-dimensional) Contours View, a 3D (three-dimensional) Wireframe View and a Peak Interface Pressure versus Time Plot22.
The 2D Contours View showed interface pressure depicted according to a user-selected colour scale and interpolated the pressure between adjacent sensels. This interpolation provided a ‘smoothed’ rather than a ‘pixellated’ view of the pressure across the measurement area. As the 2D Contours View displayed the pressure at all interfacing areas across the measurement surface, an assessment of the skin contact shapes could be made from this view.
A determination of shapes was made post-factum from recorded data using the 2D Contours View display screen. As described earlier, in this view the software presented 10 pictures of the total skin contact area for each patient on the measurement surface. Each image was visually reviewed and coded as oval, round, rectangle, pear or square. The decision for allocating each sample to the particular shape was that: (1) the pattern of the interfacing skin fitted this general description; and (2) there was consistency in shape over the period of 10 readings (or pictures). In the event that the upper legs and/or lower back were also represented on the screen, the shape was determined without taking this information into account. The coded shapes were added to the Excel database. The categorisation was confirmed independently by a second researcher.
Data analysis
A series of correlation tests was conducted on all variables to determine the strength and direction of the linear relationship between pairs of variables. Spearman’s rank-order correlation was used because the data were not normally distributed. The Mann-Whitney U test was used to explore differences between interface pressure shapes and to assess the size of the observed effect. The Mann-Whitney z value was transformed to a ‘r’ value (r=z/square root N where N is sample size) to enable consideration of small, medium and large strengths of correlation20. The strength of the correlations observed were assessed from value of r as being 1) small for r between 0.1 and 0.29, 2) medium for r between 0.3 and 0.49, and 3) large for r between 0.5 and 1.020.
Ethical considerations
Ethics approvals were gained from one university and two health care institutional committees. Informed consent was obtained from each individual participant of the study.
Results
A total of 126 patients consented to participate in the original study, from which six were subsequently excluded. Two patients could not tolerate the required period of immobility, three were excluded with extremely high interface pressure readings and one was excluded as the recorded visual shape was outside the parameters of the interface mat. The final sample comprised 56.7% males (n=68) and 43.3% females (n=52), ranging in age from 18 to 88 years, and has been described in a previous paper by the authors19.
The ClinSeatTM interface pressure mapping system’s software displayed a visual image that represented the skin contact of the buttock area, inclusive of the sacral and ischial regions, onto the surface of the pressure mapping mat. From an investigation of the patterns, five distinctive shapes could be categorised. These shapes were described as round, oval, square, pear and rectangle. The frequency of the round shape was the highest of the five identified shapes: round 54.2% (n=65); oval 19.2% (n=23); square 15.8% (n=19); pear 5.8% (n=7); and rectangle 5% (n=6). As described in the methods section, these shapes were reduced from five to two groups, namely round/square (n=84) and other shapes (n=36). The division into these two groups was based on the overall broad visual commonality within an initial set of five shapes identified by the two researchers. Visually, the two groups represented a more compact group (square/round) as opposed to elongated shapes (pear, oval and rectangle). Differences in the other characteristics confirmed this dichotomous categorisation. Therefore, once the shapes had been classified, other characteristics were explored within each group, namely BMI, Waterlow Risk Assessment Tool score, and peak interface pressure as described in detail in Table 1. These groupings were considered as being important to provide an insight into whether any effect due to shape could be discerned.
Table 1: Shape-specific data for BMI, Waterlow Risk Assessment Score and peak interface pressure
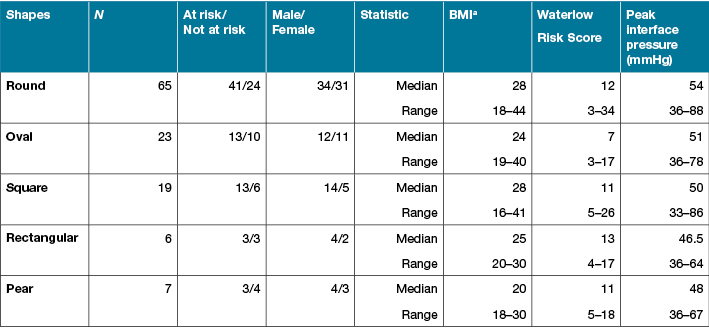
a BMI = Body mass index
The differences between the two groups were explored with respect to all variables. The results of the Mann-Whitney U tests showed there was a statistically significant difference between the round/square and other shapes for BMI (z = –3.95, p<0.01), weight (z = –3.11, p<0.01) and Waterlow Risk Assessment Tool score (z = –2.74, p<0.01) although effect size was small with the exception of BMI and shape (Table 2). There was no difference between the shapes with respect to peak interface pressure and pressure gradients measured at 1.5 and 2.5 cm from the point of peak interface pressure. In summary, having a round or square shape as identified by an image produced by the interface pressure mapping system was associated with a higher Waterlow risk score, higher weight and higher BMI.
Table 2: Pressure injury risk factor characteristics and peak interface pressure measurements: differences between body shapes
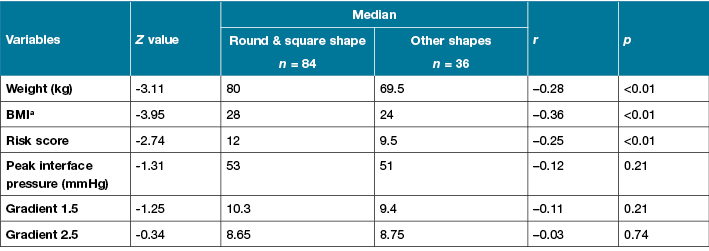
a BMI = Body mass index
Discussion
Exploring the effect of shape on BMI
In this study it was observed that there was an effect on shape that correlated with BMI and weight. Higher BMI and higher weight correlated with the round/square shapes, with this group having a BMI of 28 compared to 24, and weight approximately 10 kg higher. Given that weight and BMI are linked, further discussion will be limited to the effect of BMI only.
The measurement of BMI provides an indication of the nutritional status of the individual27,28. Furthermore, BMI is considered as a more accurate tool for evaluating nutritional status than weight alone as increased weight does not necessarily equate to a better nutritional status29. A link between poor nutritional status and the risk of pressure injury development has also been suggested1,3,27,30. The relationship between BMI and shape may therefore be useful. Patients with a BMI in the range 18.5 to 25 are considered to have a healthy weight/height ratio. Individuals with a BMI greater than 25 are considered to be overweight, whilst those under 18.5 are considered underweight31.
Wells, Treleaven and Cole13 have also identified that the human body shape can be a source of information about health risks in patients. Whilst the Wells, Treleaven and Cole13 research focused on the utility and application of 3D, all-of-body shape information for disease risk assessment, the shapes investigated in this study are consistent with their approach as the shapes examined here represent a 2D view of the 3D buttock region lying 30 degrees supine. It has also been suggested that body shape has utility as a “marker of health status” and that a “clinical focus on shape may achieve greater ‘connection’ with the patient than does BMI, which is difficult for the layperson to calculate and interpret”13.
This study has shown that round/square shapes are associated with higher BMI. Whilst the implication is encouraging, the relationship observed does not recognise the greater risk associated with underweight BMI measurements, nor malnutrition. Further research is, therefore, required in order to determine the impact of each shape individually and whether a link to malnutrition can be established. Should such a link be shown, a simple catalogue of shape diversity may therefore provide information on weight distribution and hence on health risks, including a higher risk of pressure injury for some immobile patients. Patient shape information could be used as an adjunct to risk assessment tools.
Exploring the effect of shape on Waterlow Risk Assessment Score
The study identified a medium effect on risk score as a result of shape. Patients exhibiting a round/square shape were identified to have a median Waterlow risk score of 12, whereas the median risk score for the other shapes was 9.5. Whilst it is acknowledged that Waterlow includes a section on weight, this difference may mean that those having a round/square shape may be at risk of developing a pressure injury as determined by the Waterlow Risk Assessment Tool.
Risk assessment is a critical element in pressure injury management29,32. Risk assessment tools are commonly used to provide a means for standardisation and to overcome issues with inexperienced nurses making clinical judgements. Despite this, the calculation of risk of development of a pressure injury is a somewhat inexact science as indicated by various studies23,24,33. Pressure injury risk calculations are a multivariable problem as evidenced by the structure of assessment tools, including the Waterlow Risk Assessment Tool. The ability to accurately predict the development of pressure injury is, therefore, currently, extremely limited8,23,25,33,34. The use of these tools in clinical practice is well established due to current recommendations in national and international guidelines on the prevention and management of pressure injuries. However, this compulsory screening of patients’ risk level using these tools on presentation into health facilities should only be used as an adjunct, rather than a replacement to clinical judgement35.
Defloor15 noted that the structure of most risk tools is not research-based. The Waterlow Risk Assessment tool, developed over 30 years ago through empirical study, is an example of this situation. The utilisation of shape may be an easy to implement addition to clinical judgement and could be used in conjunction with a more formal risk assessment using the Waterlow Risk Assessment Tool. It should also be noted that Moore and Cowman36 conducted a Cochrane Review on risk assessment tools for the prevention of pressure ulcers, and concluded that the efficacy of risk assessment tools in reducing the incidences of pressure injury were yet to be established.
Exploring the implications of the lack of other shape effects
Swain and Bader have noted that “the shape of a subject will have an effect on the interface pressure”14. They further suggest that the effects on interface pressure due to anatomical characteristics are likely to be subtle, and that patients with similar body types can exhibit significantly different interface pressure. As noted previously, no effect due to shape was observed for the pressure mapping indices, namely peak interface pressure and pressure gradient. The implication of this finding may be that variations of shape for an individual over time are important with respect to interface pressure, rather than the ability to correlate shape and interface pressure across a complete population at a single point in time. This issue requires further research.
In a clinical environment, shape can be visually observed for patients in potential risk groups by non-invasive methods. Swain and Bader14 suggest that, for clinical use, a graphical representation of the interface pressures and of the patient-surface interface area (that is, the shape) may be a more important representation that the absolute accuracy of interface pressure measurements alone. They also suggest that at-risk patients will demonstrate a change in shape due to loss of muscle tone. Whilst the findings within this study do not necessarily support this statement14, further longitudinal studies may indicate whether shape change may be a precursor to increased risk of pressure injury development. Should the Swain and Bader14 postulation with respect to shape and risk be correct, shape may be a clearer conduit to achieve early indication of increased pressure injury risk than measurement of the interface pressure itself.
Limitations
Determination of shape has been based solely on visual observation and interpretation, and shapes have been amalgamated into two broad categories. Division of buttocks into five groups, and subsequently two groups, was confirmed by two researchers, but the judgement was a qualitative one. Given that an effect due to shape has been determined for weight, BMI and the risk score (as determined by the Waterlow Risk Assessment Tool), additional work on developing a more stringent series of shape determination guidelines could be useful in further examining this area. This further consideration should include each shape separately as this may provide additional information for the utilisation of shape in clinical application.
Conclusion
This study has contributed to the knowledge base pertaining to pressure injury risk assessment through the investigation of patients in a busy clinical hospital environment. It is argued that the utilisation of visual interface pressure mapping technology, and an assessment of interface shape, may provide a valuable adjunct, or possibly an alternative, to the use of risk assessment tools. Further study into the utilisation of visual techniques, and the utilisation of these techniques in risk assessment, is believed to have potential to provide improved patient outcomes through prevention of pressure injury.
Relevance to clinical practice
A link between body shape as observed on an interface pressure map and assessed risk of developing pressure injury would have direct relevance to clinical practice by providing an adjunct, or alternative, to the use of risk assessment tools. Such a visualisation regimen could be utilised on patient admission but, importantly, could have most utility for long-stay patients where changes in interface pressure body shape may become an indicator of increasing pressure injury risk.
Acknowledgements
Data collection for this study was funded through an AusIndustry Grant (GRA02857) in partnership with Australian HealthCare Industries (formerly Bosshard Medical).
Thanks to staff of the Canberra Hospital and Calvary Health Care, ACT. Thanks also to Associate Professor Diane Phillips and Associate Professor Judy Currey of Deakin University, Co-supervisors for Ms Dunk’s MNurs (Research).
Author(s)
Ann Marie Dunk
RN, BHthSc (Nurs), Wound Care Cert, MACN, MNurs (Research)
Adjunct Associate Professor, University of Canberra, University Drive, Bruce, ACT 2617
Clinical Nurse Consultant, Tissue Viability Unit, Canberra Hospital & Health Services, ACT Health, Yamba Drive, Garran, ACT 2605, Australia
Tel (02) 6244 2954
Email annmarie.dunk@act.gov.au
Anne Gardner*
RN, Crit Care Cert, BA, MPH, PhD
Professor of Nursing, School of Nursing, Midwifery and Paramedicine, Australian Catholic University, 223 Antill Street, Watson, ACT 2602, Australia
Tel (02) 6209 1330
Email anne.gardner@acu.edu.au
* Corresponding author
References
- Collier M, Moore Z. Etiology and risk factors. In: Romanelli M, Clark M, Cherry G, Colin D, Defloor T (eds). Science and Practice of Pressure Ulcer Management. London: Springer; 2006:177–81.
- Hibbs P. The economics of pressure ulcer prevention. Decubitus 1988;1:32–8.
- European Pressure Ulcer Advisory Panel and National Pressure Ulcer Advisory Panel. Prevention and Treatment of Pressure Ulcers: Clinical Practice Guideline. Washington DC: National Pressure Ulcer Advisory Panel; 2009.
- National Pressure Ulcer Advisory Panel, European Pressure Ulcer Advisory Panel and Pan Pacific Pressure Injury Alliance. Prevention and treatment of pressure ulcers: Clinical Practice Guideline. Osborne Park, Australia: Cambridge Media; 2014.
- Graves N, Birrell F, Whitby M. Effect of pressure ulcers on length of hospital stay. Infect Control Hosp Epidemiol 2005;26:293–7.
- Franks PJ. The cost of pressure ulceration. EWMA J 2007;7:15–8.
- Upton D, Upton P. Different Wound Type. Psychology of Wounds and Wound Care in Clinical Practice. Switzerland: Springer, 2015;113–42.
- Baharestani MM. Quality of life and ethical issues. In: Baranoski S, Ayello EA (eds). Wound Care Essentials Practice Principles. 2nd ed. Philadelphia: Lippincott Williams & Wilkins; 2008:2–17.
- Ousey K. Pressure ulcers: Understanding the challenges of promoting quality. Br J Nurs 2010;19:755–60.
- Hietanen H. Pressure ulcer patients’ quality of life from a nurse’s perspective. In: Romanelli M, Clark M, Cherry G, Colin D, Defloor T (eds). Science and Practice of Pressure Ulcer Management. London: Springer; 2006:7–9.
- Riley S, Bader DL. Biomechanical measurements of back shape and interface pressures in unsupported sitting. Clin Biomech 1988;3:114–7.
- Urasaki M, Nakagami G, Sanada H, Kitagawa A, Tadaka E, Sugama J. Interface pressure distribution of elderly Japanese people in the sitting position. Disabil Rehabil Assist Technol 2011;6:38–46.
- Wells JCK, Treleaven P, Cole T. BMI compared with 3-dimensional body shape: The UK national sizing survey 1–3. Am J Clin Nutr 2007;85:419-25.
- Swain I, Bader D. The measurement of interface pressure and its role in tissue breakdown. In: Clarke M (ed). Pressure Ulcers: Recent advances in tissue viability. Salisbury: Mark Allen Healthcare Ltd, 2004:39-55.
- Defloor T. The risk of pressure sores: A conceptual scheme. J Clin Nurs 1999;8:206–16.
- Lindan O, Greenway R. Pressure distribution on the surface of the human body. Arch Phys Med Rehabil 1965;46:378–85.
- Gardner A, Dunk AM, Eggert M, Gardner G, Wellman D. Pressure injury: An exploration of the relationship between risk factors and interface pressure. Primary Intention 2006;14:140–9.
- Waterlow J. Pressure sores: A risk assessment card. Nurs Times 1985;81:51–5.
- Dunk AM, Gardner A. The contribution of pressure gradients to advancing understanding of deep tissue injury to sacral regions. Wound Practice and Research 2015;23:116–22.
- Cohen JW. Statistical power analysis for the behavioral sciences. 2nd edn. Hillsdale, New Jersey: Lawrence Erlbaum Associates; 1988.
- Australian Wound Management Association. Pan Pacific Clinical Practice Guideline for the Prevention and Management of Pressure Injury. Osborne Park, Australia: Cambridge Media; 2012.
- Tekscan. Clinical setting pressure assessment system: User manual. Massachusetts: Tekscan, Inc.; 2001.
- Torra i Bou JE, Garcia-Fernandez FB, Pancorbo-Hidalgo PL. Furtado K. Risk assessment scales for predicting the risk of developing pressure ulcers. In: Romanelli M, Clark M, Cherry G, Colin D, Defloor T (eds). Science and Practice of Pressure Ulcer management. London: Springer; 2006:43–57.
- Anthony D, Papanikolaou P, Parboteeah S, Saleh M. Do risk assessment scales for pressure ulcers work? J Tissue Viability 2010;19:132–6.
- Kottner J, Balzer K. Do pressure ulcer risk assessment scales improve clinical practice? J Multidiscp Healthc 2010;3:103–11.
- Waterlow J. Waterlow Pressure Ulcer Prevention Manual. Judy-Waterlow; 2005 [cited 2009 July 26]. Available from: http://www.judy-waterlow.co.uk/the-waterlow-manual.htm
- Ousey K. Pressure area care. Oxford: Blackwell Publishing; 2005.
- Posthauer ME, Thomas DR. Nutrition and wound care. In: Baranoski S, Ayello EA (eds). Wound Care Essentials Practice Principles. 2nd edn. Philadelphia: Lippincott Williams & Wilkins, 2008:172–201.
- Baranoski S, Ayello EA, Tomic-Canic M. Skin: An essential organ. In: Baranoski S, Ayello EA (eds). Wound Care Essentials Practice Principles. 2nd ed. Philadelphia: Lippincott Williams & Wilkins; 2008:47–63.
- Black JM, Edsberg LE, Baharestani MM et al. Pressure ulcers: Avoidable or unavoidable? Results of the National Pressure Ulcer Advisory Panel Consensus Conference. Ostomy Wound Manag 2011;57:24–37.
- World Health Organisation. Global Database on Body Mass Index: BMI Classification. World Health Organisation; 2006 [cited 2010 June 10]. Available from: http://apps.who.int/bmi/index.jsp?introPage=intro_3.html
- Mastronicola D, Romanelli M. Clinical and instrumental assessment of pressure ulcers. In: Romanelli M, Clark M, Cherry G, Colin D, Defloor T (eds). Science and Practice of Pressure Ulcer Management. London: Springer; 2006:91–8.
- Papanikolaou P, Lyne PA, Lycett EJ. Pressure ulcer risk assessment: Application of logistic analysis. J Adv Nurs 2003;44:128–36.
- Defloor T, Grypdonck MFH. Validation of pressure ulcer risk assessment scales: A critique. J Adv Nurs 2004;48:613–21.
- Jull A & Griffiths P. Is pressure sore prevention a sensitive indicator for the quality of nursing care? A cautionary note. Int J Nurs Stud 2010;47:531–3.
- Moore ZE, Cowman S. Risk assessment tools for the prevention of pressure ulcers. Cochrane Database Syst Review 2014:CD006471.