
Volume 41 Number 2
Budget impact of ceramide-infused skin barriers versus standard of care skin barriers for new ostomates: a six-country analysis
Ariel Berger, Gary Inglese, George Skountrianos, Davide Croce and Mustafa Oguz
Keywords ostomy, models, ceramides, economic evaluation, costs and cost analysis
For referencing Berger A et al. Budget impact of ceramide-infused skin barriers versus standard of care skin barriers for new ostomates: a six-country analysis. WCET® Journal 2021;41(2):22-31
DOI https://doi.org/10.33235/wcet.41.2.22-31
Abstract
Introduction In a randomised controlled study, the use of ceramide-infused skin barriers (CIB) resulted in lower costs of care over 12 weeks versus using a standard of care (SoC) skin barrier. However, the degree to which this information may influence prescribing patterns of ostomy products, and its corresponding impact on payers’ budgets, has not been examined.
Purpose To examine expected budget impact of CIB among recent ostomates in the United States (US), the United Kingdom (UK), Sweden, Australia, Italy and Norway.
Design A decision-analytic budget impact model.
Methods Total ostomy-related costs (i.e., skin barriers, ostomy accessories, care of peristomal skin complications [PSC]) were forecasted over 1 year for hypothetical cohorts of recent ostomates in each country of interest. Costs were assessed under two alternative scenarios – one in which all patients were assumed to use barriers other than CIB (the SoC scenario), and one in which 20% of patients were assumed to use CIB in lieu of SoC (the CIB scenario). The budget impact was assumed equal to the difference in these two scenarios.
Findings The use of CIB was expected to result in annual savings of US$6.6m in the US, £0.4m in the UK, SEK1.8m in Sweden, A$0.4m in Australia, €0.2m in Italy and NOK1.5m in Norway. Findings were consistent in sensitivity analyses.
Conclusions The use of CIB versus other barriers results in expected lower costs to the payers in each evaluated country. Further research is needed to better understand the complete clinical and economic benefits associated with the use of CIB.
Introduction
Faecal ostomy surgery is performed to treat both acute (e.g., trauma) and chronic (e.g., colorectal cancer, Crohn’s disease, ulcerative colitis) conditions. While effective for the underlying issue(s), an ostomy also has its own risk of complications, including peristomal skin complications (PSC) such as: mechanical, e.g., stripping or abraded skin; irritant dermatitis, typically caused by leakage that exposes the skin to ileostomy output; and infectious dermatitis. PSC are among the most commonly reported complications among ostomates, and may occur at any time following stoma creation1–3. Between 33.5% and 78.7% of ostomates report PSC4–11; one study estimated that 40% of consultations to ostomy clinics were for PSC12,. In 2011, the mean costs of care for PSC were estimated to range per ostomy from €32.45 for mild cases to €147.17 for severe cases, and the mean total costs of care (including ostomy pouching systems, accessories, visits to healthcare providers, hospitalisation and medications) over 7 weeks were shown to be approximately 22% greater among patients who experienced PSC versus those who did not5. PSC are also associated with deleterious impacts to quality of life, with a “loss” of approximately 11 quality-adjusted life-days (QALDs)/month for patients with severe PSC (versus no PSC)13.
CeraPlusTM is a novel skin barrier with Remois technology (Alcare Co Ltd, Sumida-ku, Tokyo, Japan) currently marketed by Hollister Inc. (Libertyville, Illinois, US). It is a ceramide-infused barrier (CIB) designed to support healthy peristomal skin. Ceramides are naturally occurring lipids that are essential to the barrier function of the skin and lipid bilayer of the stratum corneum14,15, and play an important role in the prevention of transepidermal water loss (TEWL) by fusing with corneocytes in the stratum corneum to help form a protective layer16,17.
In the ADVOCATE trial15 (a study determining variances in ostomy skin conditions and the economic impact: NCT02401412), 153 adults with healthy peristomal skin who had recently undergone ostomy surgery were randomly assigned to use CIB (n=79) or an alternative barrier (New Image FlexWear or New Image Flextend [Hollister Inc.]) (n=74). Over a maximum follow-up of 12 weeks (patients were assessed over 8 weeks, with those who experienced PSC observed for an additional 4-week “resolution period”), the mean costs of care among patients randomised to CIB were US$36.36 less than those randomised to control barrier (US$223.73 vs. US$260.19; p=0.017); they also were nominally less likely to experience PSC during follow-up15. A subsequent cost-effectiveness analysis indicated that the use of CIB among a hypothetical cohort of 100 Australian patients was expected, over 1 year, to result in 16 fewer PSC, an additional 35 QALDs, and a reduction in healthcare costs of A$13,700 (all versus standard of care [SoC]); the resulting net monetary benefit was A$17,400, indicating that CIB was a cost-effective alternative to SoC18.
Study/publication purpose
While CIB has been found to be cost-effective versus other barriers in both ADVOCATE and subsequent economic modelling, healthcare payers must also consider the overall expected impact to budgets (i.e., affordability) associated with the adoption of new technologies. Practitioners play an important role in the care of new ostomates, and are often asked to balance patients’ needs with cost-containment pressures imposed upon them by payers. Accordingly, findings presented herein are likely of great interest to nurse clinicians and other providers of care for this vulnerable population as it uses published information on patient-level efficacy and on the safety of CIB to estimate their expected value to payers.
To examine this and related questions, we developed a decision-analytic model that could estimate the budget impact associated with the use of CIB in lieu of other skin barriers. This model was estimated for the United States (US), the United Kingdom (UK), Sweden, Australia, Italy and Norway, based on information from ADVOCATE and supplemented with other sources where appropriate.
Methods and Procedures
Model overview
All patients were assumed to begin the model within 12 weeks of faecal stoma surgery outside hospital settings using either a CIB pouching system or a SoC system. The distribution of patients by ostomy type was assumed to be consistent with that reported by ADVOCATE and to be similar between patients who would use CIB versus SoC – 39%, 52% and 9% of subjects randomised to CIB in ADVOCATE had undergone ileostomy, colostomy and urostomy, respectively; corresponding values for subjects randomised to SoC were 36%, 54% and 10%, respectively; p=0.9715. We did not differentiate between type of ostomy as there was no statistically significant difference in the distribution of ostomy type at baseline in the ADVOCATE trial.
The model calculated the expected total 1-year ostomy-related medical costs under two alternative scenarios – one in which all patients were assumed to use barriers other than CIB (the SoC scenario), and one in which a percentage of patients were assumed to use CIB in lieu of SoC (the CIB scenario). We assumed that the SoC scenario represented any number of barriers from multiple manufacturers. Ostomy-related costs include ostomy pouching systems, ostomy accessories and PSC management, such as: specialist and nurse visits; facility fees (for US and Australia); topical steroids and antibiotics; and additional use of barriers, pouches and accessories due to increased frequency of barrier change. Budget impact was estimated by subtracting the total expected ostomy-related costs under the SoC scenario from those under the CIB scenario. The time horizon for the model was 1 year (i.e., 12 30-day months). Model programming was consistent with recommendations on budget impact analyses19. A schematic of the model is presented in Figure 1; key modelling assumptions are presented in Table 1.
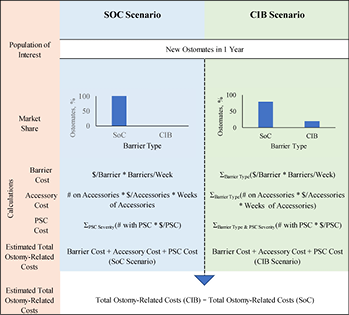
Figure 1. Model schematic
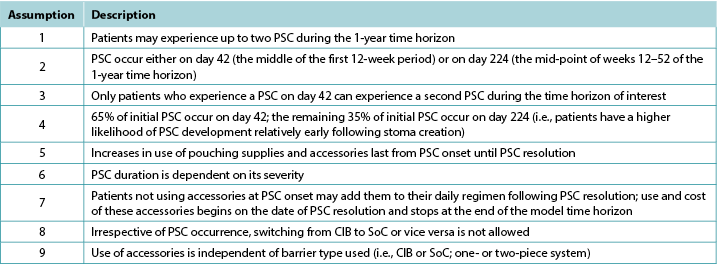
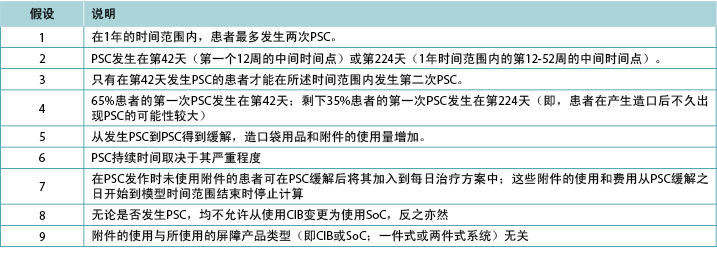
Table 1. Key modelling assumptions
Ostomy pouching systems and accessories
The use of ostomy pouching systems was based on country-specific information, as were the costs of healthcare services, including the 2018 Medicare schedule (US), the 2017–18 National Schedule of Reference Costs, NHS Trust and NHS Foundation Trusts (UK), the 2018 Regionala Priser Och Ersättningar för Södra Sjukvårdsregionen (Sweden), the 2019 (June) Stoma Appliance Scheme Schedule (Australia)20, the Sistema Socio Sanitario – Regione Lombardia (ATS Milano Città Metropolitana) (Italy), and the 2019 (January) Produkt-og Prisliste Refusjonsberettiget etter §5–14 Medisinsk Forbruksmateriell ved Stomi (Norway). Except for the UK, costs of CIB pouching systems were assumed equivalent to those of SoC systems. Values for all relevant parameters are provided in Appendix A.
The use of ostomy accessories (e.g., flat rings, ostomy belts, adhesive remover spray) was based on information from ADVOCATE unless more relevant country-specific data were available (Table 2). Accessory use was captured by means of an ‘average accessory use profile’ based on percentages of patients assumed to use each accessory, and the corresponding number of units and cost. Accessory use was assumed dependent on weekly frequency of change of pouching system.
Table 2. Accessory use, by country
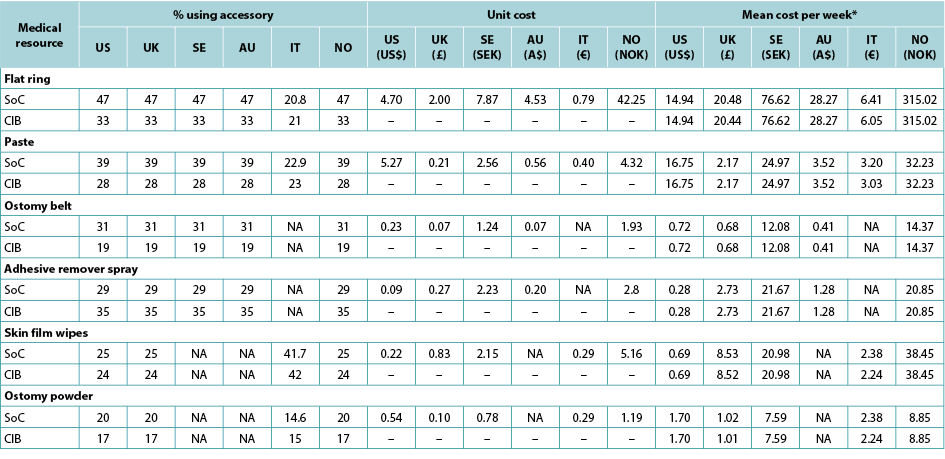
* Calculated using the average of the number of ostomy system changes per week, weighted by the proportions receiving one- and two-piece systems respectively.
PSC incidence
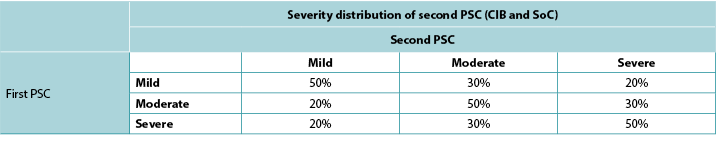
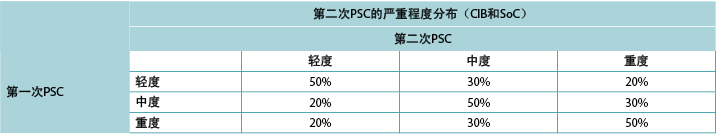
Consistent with ADVOCATE, we assumed that 55% of SoC patients and 41% of CIB patients would experience PSC; PSC severity distributions were taken from ADVOCATE (Figure 2). Given its relatively short follow-up, ADVOCATE was not used to estimate probability of a second PSC. Accordingly, we arbitrarily assumed that 10% of CIB patients would experience a second PSC, that the 5% risk difference observed in ADVOCATE was constant, and therefore that 15% of SoC patients would experience a second PSC. We also assumed that addition of accessories following the initial PSC would reduce the risk of subsequent PSC by 50% (i.e., 7.5% for SoC; 5% for CIB). The severity of the second PSC was dependent on that of the first (Table 3).
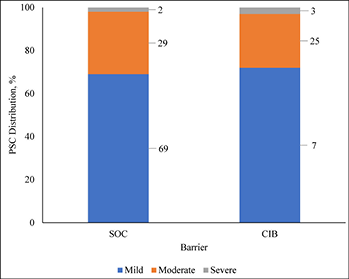
Figure 2. Distribution of PSC severity by barrier received
Table 3. Severity distribution of second PSC based on severity of first PSC
As per ADVOCATE, the time to PSC resolution was assumed to be 18 days for mild cases (defined in ADVOCATE as a Discoloration, Erosion, Tissue overgrowth [DET] score <4), and 33 days for moderate cases (4≤ DET <7) and severe cases (DET ≥7). Time to resolution was assumed invariant to barrier choice. Patterns of use of various healthcare services during PSC were based on information from ADVOCATE; while one-piece pouching systems were not evaluated, we assumed that these barriers would perform similarly to their two-piece counterparts. As per ADVOCATE, we assumed that the use of pouching supplies among CIB patients would increase by 29% for mild PSC, by 83% for moderate PSC, and by 83% for severe PSC; corresponding increases among SoC patients were 64%, 49% and 49%, respectively. We also assumed PSC management was similar in each country (Table 4).
Table 4. Use and cost of healthcare services during PSC, by PSC severity, barrier received, and country
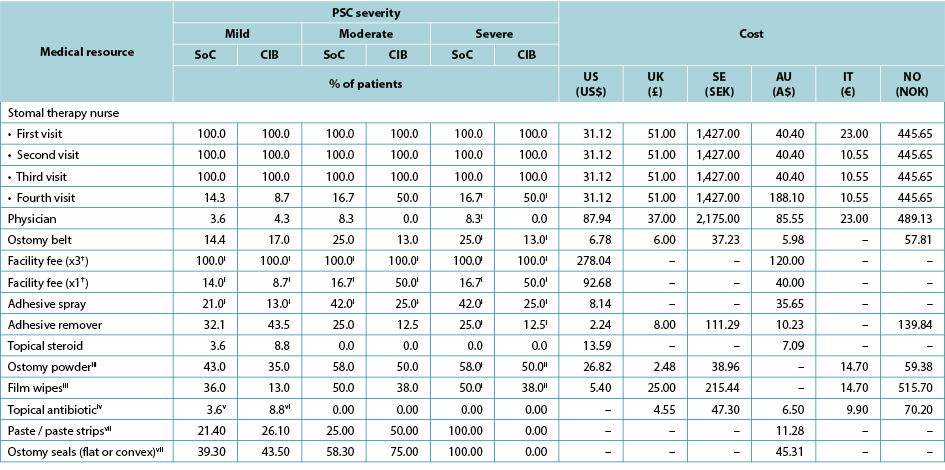
† Facility fee (x3) is the facility fee associated with the first three STN visits. Facility fee (x1) is the facility fee associated with the fourth STN visit.
i 0% for the UK, Sweden, Norway and Italy
ii 100% for the UK, Sweden, Norway and Italy
iii 0% in Australia
iv 0% in the US; values in the table are for the UK, Sweden, Norway and Italy
v 7.1 in Australia
vi 8.7 in Australia
vii Australia only
We assumed that there would be 149,000 ostomates in the US, 29,000 in the UK, 6,900 in Sweden, 9,000 in Australia, 17,000 in Italy and 3,700 in Norway. For the US, ostomates were assumed to be enrolled in a health plan comprised of 58,400,000 members; estimates of plan size were limited to the US as payers in the US tend to view estimates of budget impact in terms of costs per-member per-month (PMPM) which is estimated by dividing the expected cost by the total number of plan members and then dividing the resulting quotient by 12. Country-specific estimates of changes in population size (both plan members and number of ostomates) is presented in Table 5, as is the assumed annual inflation rate for medical costs.
Table 5. Country-specific estimates of changes in population size (both plan members and number of ostomates) and the assumed annual inflation rate for medical costs: assumptions for a 5-year analysis
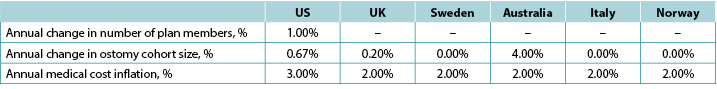
Note: Positive values denote expected increases; negative values expected decreases
Data Analysis
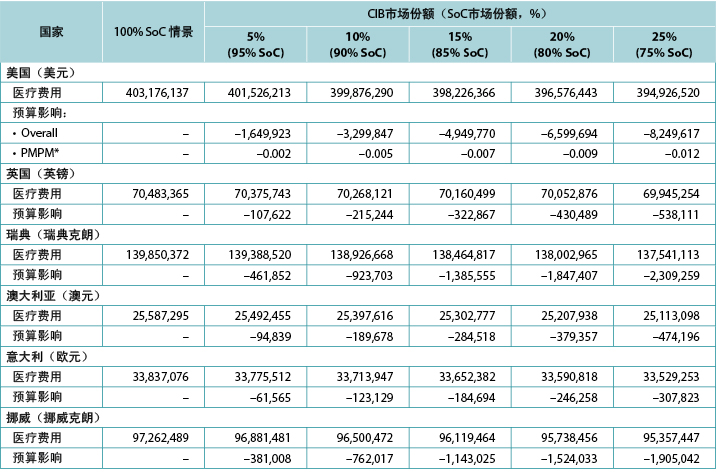
The model generated total expected numbers of expected PSC under both scenarios and corresponding expected ostomy-related costs, i.e., PSC-related care plus ostomy-related care. The 1-year budget impact was estimated by subtracting the total expected costs under the CIB scenario from those of the SoC scenario. We calculated the estimates of the budget impact alternatively, assuming uptake of CIB to be 5%, 10%, 15%, 20% and 25% (all versus 0% for the SoC scenario) (Table 6).
Table 6. 1-year budget impact results under different CIB scenarios
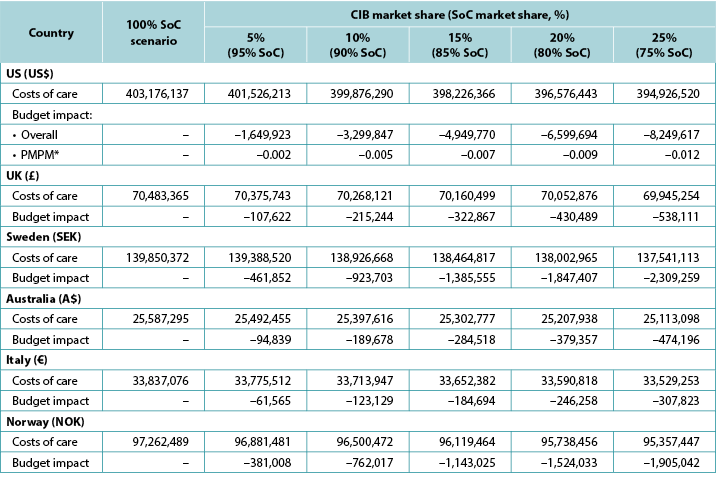
* Based on a plan with 58,400,000 members.
Note: Negative values denote expected savings.
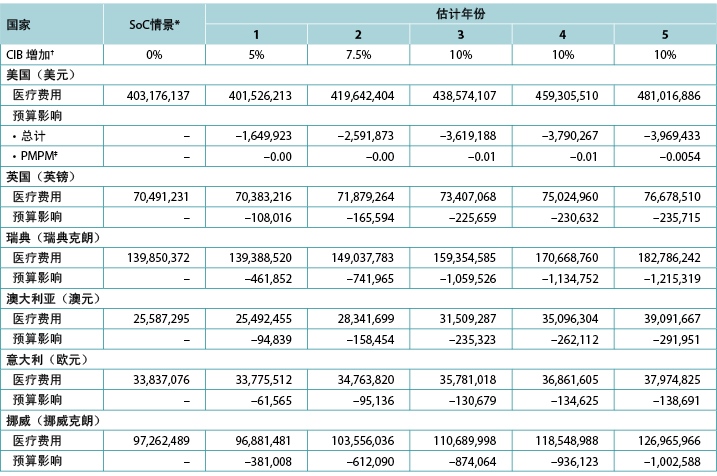
We examined the 5-year expected budget impact of CIB, considering cost inflation and annual changes in ostomy cohort size; in addition, for the US, we estimated annual change in plan enrolment (Table 5). We also varied the uptake of CIB over time, assuming 5% would use these barriers in year 1 of the CIB scenario, 7.5% in year 2, 10.0% in year 3, 10.0% in year 4 and 10.0% in year 5 (all versus 0% for SoC) (Table 7).
Table 7. Expected annual budget impact of CIB over 5 years
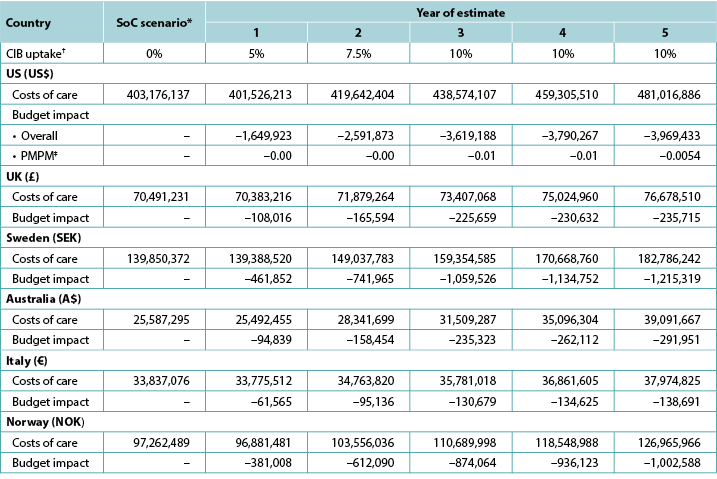
* Costs of care under the SoC scenario increase annually due to inflation and assumptions on cohort size.
† In each year of interest, all patients not assumed to use CIB were assumed to use SoC barriers.
‡ Based on a plan with 58,400,000 members.
Note: Negative values denote expected savings.
We conducted a sensitivity analysis in which the costs of PSC were changed to those reported in a retrospective study of ostomates identified in a US integrated healthcare system by Taneja and colleagues21; findings from their study indicated that patients who experienced PSC averaged US$8,031 more in all-cause medical-care costs over 120 days than those who did not (US$58,329 versus US$50,298; p=0.251)21. For this analysis, we used the model to estimate the incidence of PSC in both the SoC and CIB cohorts, and used these proportions to calculate average costs for a patient assumed to use SoC and CIB, respectively. We then multiplied these costs by the corresponding market shares for SoC and CIB, respectively, to calculate the expected budget impact of CIB. Due to the source of cost and utilisation estimates, this analysis was limited to the US.
We also conducted deterministic sensitivity analyses (DSA) to examine the sensitivity of model output to varying parameter values. In these analyses, each model parameter was varied to its lower and upper 95% confidence interval (CI) value, respectively.
Results
1-year model
Over 1 year, the total expected stoma-related costs for the SoC scenario were US$403.2m in the US, £70.5m in the UK, SEK139.9m in Sweden, A$25.6m in Australia, €33.8m in Italy, and NOK97.3m in Norway; corresponding values for the CIB scenario (20% of patients in each country assumed to use CIB in lieu of SoC; 80% used SoC) were US$396.6m, £70.1m, SEK138.0m, A$25.2m, €33.6m and NOK95.7m respectively. Resulting budget savings associated with CIB were therefore US$6.7m in the US, £0.4m in the UK, SEK1.8m in Sweden, A$0.4m in Australia, €0.2m in Italy, and NOK1.5m in Norway. As the use of CIB was expected to be cost-saving, the corresponding PMPM impact in the US was also expected to be cost-saving, although relatively small due to the large number of assumed plan members (Table 6).
5-year model
Five-year analyses yielded cost savings ranging from US$1.7m in year 1 to US$4.0m in year 5 in the US, from £0.1m in year 1 to £0.2m in year 5 in the UK, from SEK0.5m in year 1 to SEK1.2m in year 5 in Sweden, from A$0.09m in year 1 to A$0.3m in year 5 in Australia, from €0.06m in year 1 to €0.3m in year 5 in Italy, and from NOK0.4m in year 1 to NOK1.0m in year 5 in Norway (Table 7). Over the longer period, the use of CIB in a relatively limited population (i.e., a maximum of 10% of all eligible ostomates in any given year) resulted in expected cost savings of stoma-related care of US$15,620,684 in the US, £965,616 in the UK, SEK4,613,414 in Sweden, A$1,042,678 in Australia, €560,695 in Italy, and NOK3,805,873 in Norway.
Deterministic sensitivity analyses
The 20 variables for which budget impact results are most sensitive are presented for each country in Figures B1–B6 in Appendix B, i.e., one figure per country. Regardless of country, variables with the largest effect on budget impact were the percentage of patients using pouching supplies and accessories with relatively high unit costs, and the annual probability of PSC given the use of SoC barriers. In the US and Australia, CIB remained cost-saving across all DSAs conducted; in the other countries it was expected to be cost-saving in all sensitivity analyses except one ‘extreme’ scenario – the percentage of patients using more costly pouching supplies or accessories was set to the lower-bound 95% CI value of weekly costs for SoC and the higher-bound 95% CI value for CIB. In this extreme scenario, expected budget increases were <1% of annual costs of care expected under the SoC scenario (£207,042 in the UK, SEK116,916 in Sweden, €293,897 in Italy and NOK112,709 in Norway). In all countries evaluated, CIB was expected to be cost-saving when the probability of PSC with SoC was set to its lower-bound 95% CI value and the corresponding estimate for CIB was set to its higher-bound 95% CI value.
Scenario analysis
When we replaced cost inputs derived from ADVOCATE with those estimated using real-world US data over the 120-day period following ostomy surgery, resulting estimates of budget savings associated with an increased use of CIB were greater than those obtained in the base case (Table 8).
Table 8. Expected 1-year budget impact associated with the use of CIB and real-world healthcare costs in US patients
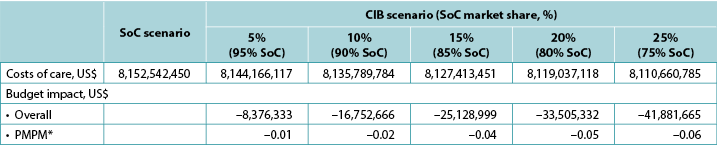
* Based on a plan with 58,400,000 members.
Discussion
Findings from our study suggests that the use of CIB in lieu of other skin barriers is expected to result in savings to payers within 1 year. The magnitude of expected savings is dependent on the percentage of ostomates who would use CIB instead of other skin barriers. Estimates of impact were greatest for the US (from US$1.7m at 5% CIB to US$8.3m at 25% CIB), and lowest for Norway (from NOK381,008 [US$43,321] at 5% CIB to NOK1,905,042 [US$216,603] at 25% CIB)22. Estimates for the US were substantially larger than those expected for other countries of interest, likely due to its relatively high costs of medical care (including accessories) versus the other countries included in this evaluation. CIB was expected to result in lower costs of care (i.e., savings) across all six countries assessed.
Results were fairly robust in sensitivity analyses. 5-year projections of budget impact were most heavily influenced by assumptions of market share of CIB, although additional payer savings were projected simply by increasing the number of ostomates and/or costs of medical care, respectively. Similarly, results of the scenario analysis that used real-world US costs of PSC as opposed to ADVOCATE (i.e., approximately US$8,000 versus US$36.46 over a 12-week period) also projected increased savings in all scenarios (versus SoC) relative to the base case, irrespective of assumed CIB uptake. However, this scenario included all-cause healthcare costs, not only those specific to ostomy care. Unsurprisingly, CIB was found to be cost-saving across nearly all DSA scenarios, with the model being most sensitive to the percentages of patients using relatively expensive pouching supplies and accessories and PSC incidence. In the one ‘extreme’ instance where the use of CIB was expected to increase total costs, the resulting budget impact represented a very modest increase in annual costs of care. Findings were consistent across all countries assessed.
While the economic value of pharmaceutical products (in terms of cost-effectiveness and budgetary impact) have been assessed for decades, comparatively less is typically done for medical devices. This is somewhat counter-intuitive, as the number of devices coming to market vastly exceed that of pharmaceuticals. In 2012, over 10,000 patent applications for medical devices were filed in Europe, which was approximately twice that for pharmaceuticals23. As opposed to cost-effectiveness analyses, which focus on the benefits of the assessed technology at the patient level, budget impact analyses examine affordability to the payer. In our opinion, this question of affordability is of equal importance. In fact, assessments of budget impact are “…an ‘essential’ part of comprehensive economic assessment of medical technology”24.
This issue is perhaps even more important in fields such as ostomy, in which nurse clinicians and other providers are often tasked with a dual, often competing, role to provide quality care while simultaneously containing costs. Accordingly, the use of economic models based on evidence obtained from randomised trials and other well-conducted studies is an important means by which healthcare professionals, payers and other interested parties can estimate the value of a given product based on its efficacy and safety. Results of such models can then be used to help align these parties on cost-effective, high-quality patient care.
We implemented principles of good practice for budget impact analyses, as set forth by the International Society for Pharmacoeconomics and Outcomes Research (ISPOR)19, including our reliance on ADVOCATE, a randomised clinical trial, for most input values used in the model, as well as the inclusion of sensitivity analyses to better understand the degree to which model output relied on inputs and assumptions. Results of our analyses are consistent with those of ADVOCATE15 and the published cost-effectiveness model18, and provide evidence that the value of CIB enjoyed by patients also manifests as cost savings to payers across various countries.
Limitations
Our study has several limitations. First, like all economic models, ours presents a somewhat simplified view of clinical practice, such as limiting to a maximum of two the incidence of PSC during 1 year, including a maximum of one PSC during an ‘early’ (i.e., 12-week) period and a maximum of one PSC during a ‘late’ (i.e., 40-week) period. The degree to which these assumptions adequately capture actual patient experience is not known. On a related matter, in the absence of data, we arbitrarily – and somewhat conservatively – set risk of a second PSC. The model also does not differ between ostomy types (e.g., ileostomy, colostomy) in terms of PSC risk, use of skin barriers, and/or use of accessories.
The economic and clinical impacts of CIB are based on findings from ADVOCATE, including but not limited to the incidence of PSCs (55% of SoC patients vs. 41% of CIB patients), and the distribution of patients by ostomy type (about one-third had an ileostomy; about one-half had a colostomy; and all other patients had a urostomy). Further study is needed to better understand the impact of CIB in different populations, both in terms of distribution by ostomy type as well as with different demographic and/or comorbidity profiles than subjects enrolled in ADVOCATE.
We also assumed that publicly available country-specific unit costs for various items used in stoma-related care were adequate representations of what is spent on care of ostomy patients by payers in each country. However, the degree to which this assumption is true for the US – which has many different types of payers (e.g., private commercial insurance, Medicare) and, within some payer types, equal if not more heterogeneity across insurers in terms of reimbursement policies – and other countries of interest in unknown.
Furthermore, while ADVOCATE was limited to the use of two-piece systems, we assumed the use of both one- and two-piece systems, and that benefits of CIB would be consistent across both types of systems. We also assumed that PSC were of fixed duration. However, other studies have reported resolution times varying between 7 weeks to over 3 months4,5,25; consequently, our analyses may have underestimated the economic consequence of PSC. We note, however, that to the degree this occurred, estimated budget impact associated with the use of CIB in lieu of other skin barriers is likely conservative, i.e., the ‘true’ magnitude of savings resulting from the use of CIB may be greater than what is estimated herein.
Conclusions
The use of CIB results in expected cost reductions to payers in the US, UK, Sweden, Australia, Italy and Norway, with the magnitude of expected reductions directly related to percentages of patients assumed to use CIB in lieu of SoC. While our findings are consistent with those of ADVOCATE and previous cost-effectiveness modelling, further research is needed to better understand the economic consequences of the use of CIB (versus other skin barriers) in clinical practice.
Conflict of Interest
Gary W Inglese and George Skountrianos are employees of Hollister Incorporated. Ariel Berger and Mustafa Oguz are employees of Evidera Inc. which provides consulting and other research services to pharmaceutical, device, government and non-government organisations. Evidera Inc. received funding from Hollister Incorporated in connection with conducting this study and with developing this manuscript. Davide Croce is an employee of the Università Carlo Cattaneo and did not receive any funding for the conduct of this study or for the development of this manuscript.
Funding
Funding for this research was provided by Hollister Incorporated.
新造口患者使用含神经酰胺皮肤屏障产品和标准护理皮肤屏障产品的预算影响对比:一项六国患者分析
Ariel Berger, Gary Inglese, George Skountrianos, Davide Croce and Mustafa Oguz
DOI: https://doi.org/10.33235/wcet.41.2.22-31
摘要
引言 在一项随机对照研究中,与使用标准护理(SoC)皮肤屏障产品相比,使用含神经酰胺皮肤屏障产品(CIB)在12周内降低了护理费用。但研究者尚未研究该信息可能对造口产品处方模式的影响程度及其对支付者预算的相应影响。
目的 研究CIB对美国、英国、瑞典、澳大利亚、意大利和挪威的新造口患者的预期预算影响。
设计 一个决策分析预算影响模型。
方法 对每个所述国家新造口患者的假设队列进行1年的造口相关总费用(即皮肤屏障产品、造口附件、造口周围皮肤并发症[PSC]的护理)预测。在两种替代情景下评估费用 - 一种是假设所有患者均使用除CIB以外的屏障产品(SoC情景),另一种是假设20%的患者使用CIB来代替SoC(CIB情景)。假设预算影响等于这两种情景的差异。
研究结果 预计使用CIB每年可在美国节省660万美元,在英国节省40万英镑,在瑞典节省180万瑞典克朗,在澳大利亚节省40万澳元,在意大利节省20万欧元,在挪威节省150万挪威克朗。敏感性分析得出的研究结果一致。
结论 在每个受评价的国家,与使用其他屏障产品相比,使用CIB的支付者的预期费用更低。需要进一步研究以更好地了解与使用CIB有关的完整临床和经济效益。
引言
进行排泄物造口手术是为了治疗急性(如创伤)和慢性(如结肠直肠癌、节段性回肠炎、溃疡性结肠炎)疾病。虽然造口术对解决潜在问题行之有效,但造口术也有其自身的并发症风险,包括造口周围皮肤并发症(PSC),如:机械性问题,如脱落或擦伤皮肤;刺激性皮炎,通常是由于渗漏使皮肤暴露于回肠造口排出物而引起;以及感染性皮炎。PSC是造口患者中最常报告的并发症之一,可能在产生造口后的任何时间发生1-3。33.5%至78.7%的造口患者报告发生了PSC4-11;一项研究估计40%的造口门诊咨询是因PSC而产生12。2011年,每个造口的PSC平均护理费用估计从32.45欧元(轻症病例)到147.17欧元(重症病例)不等,7周内发生PSC的患者比未发生PSC的患者的平均总护理费用(包括造口袋系统、附件、接受医护人员护理、住院和药物)高出约22%5。PSC还与带来生活质量的有害影响有关,严重PSC患者每月约“损失”11个质量调整生命日(QALD)(与无PSC相比)13。
CeraPlusTM 是一种采用Remois技术的新型皮肤屏障产品(Alcare Co Ltd,Sumida-ku,Tokyo,日本),目前由Hollister Inc.(Libertyville, Illinois, 美国)销售。它是一种含神经酰胺皮肤屏障产品(CIB),可用于保持造口周围皮肤的健康。神经酰胺是天然存在的脂质,对皮肤的屏障功能和角质层14,15的脂质双分子层至关重要,并且通过与角质层中的角质细胞融合,帮助形成保护层,在防止经皮水分丢失(TEWL)方面发挥着重要作用16,17。
在ADVOCATE试验15中(一项确定造口皮肤病差异和经济影响的研究:NCT02401412),153例最近接受了造口手术、拥有健康造口周围皮肤的成人被随机分配使用CIB(n=79)或替代屏障产品(New Image FlexWear或New Image Flextend[Hollister
Inc.])(n=74)。在长达12周的随访期间(患者在8周内接受评估,对于出现PSC的患者则再观察4周“缓解期”),随机分配使用CIB的患者的平均护理费用比随机分配使用对照屏障产品的患者低36.36美元(223.73美元与260.19美元;P=0.017);患者在随访期间出现PSC的可能性也较小15。随后的成本效益分析表明,在由100例澳大利亚患者组成的假设队列中使用CIB,预计在1年内可减少16例PSC,增加35个QALD,减少13700澳元的医疗费用(均相对于标准护理[SoC]);由此产生的净货币收益为17400澳元,这表明,相较于SoC,CIB是一个具有成本效益的替代方案18。
研究/发表目的
虽然在ADVOCATE和随后的经济模型中发现,CIB相对于其他屏障产品而言具有成本效益,但医疗支付者也必须考虑与采用新技术相关的因素对预算的总体预期影响(即承受能力)。执业医护人员在护理新造口患者方面发挥着重要作用,他们经常需要在患者需求和支付者带给他们的成本控制压力之间取得平衡。因此,由于本文使用发布的患者层面疗效和CIB安全性信息来估计其对支付者的预期价值,本文介绍的研究结果可能会引起为这一弱势群体提供护理的临床护士和其他医护人员的极大兴趣。
为研究这一问题及其相关问题,研究者开发了一个决策分析模型,可以估计与使用CIB替代其他皮肤屏障产品有关的预算影响。该模型是根据ADVOCATE提供的信息,并在适当的时候补充其他来源信息,对美国(US)、英国(UK)、瑞典、澳大利亚、意大利和挪威进行预算影响估计而建立。
方法和程序
模型概述
假设所有患者在接受排泄物造口手术的12周内在医院环境外使用CIB造口袋系统或SoC系统后开始建模。假设按造口类型划分的患者分布与ADVOCATE报告的患者分布一致,并且在使用CIB与SoC的患者之间相似 - 在ADVOCATE中随机分配使用CIB的受试者中,分别有39%、52%和9%的受试者接受了回肠造口术、结肠造口术和尿道造口术;随机分配使用SoC的受试者的相应数值分别为36%、54%和10%;P=0.9715。研究者未区分造口类型,因为在ADVOCATE试验中,基线的造口类型分布没有具有统计学意义的差异。
该模型计算了两种替代情景下的1年预期造口相关医疗费用总额 - 一种情景是假设所有患者均使用CIB以外的屏障产品(SoC情景),另一种情景是假设有一定百分比的患者使用CIB替代SoC(CIB情景)。研究者假设SoC情景代表多个制造商的任何数量的屏障产品。造口相关费用包括造口袋系统、造口附件和PSC管理,如:专家和护士访视;设施使用费用(针对美国和澳大利亚);局部类固醇和抗生素;以及由于增加更换屏障产品的频率而额外使用的屏障产品、造口袋和附件。预算影响是通过从CIB情景中的预期造口相关费用总额减去SoC情景中的预期造口相关费用总额进行估计。模型的时间范围为1年(即12个月,每个月30天)。模型编程与预算影响分析的建议一致19。模型示意图如图1所示;关键建模假设如表1所示。
图1.模型示意图
表1.关键建模假设
造口袋系统和附件
造口袋系统的使用是基于特定国家的信息,医疗保健服务费用也是如此,包括2018年医疗服务目录(Medicare schedule,美国)、NHS信托和NHS基金会信托2017-2018年国家参考成本明细表(英
国)、2018 Regionala Priser Och Ersattningar for Sodra Sjukvardsregionen(瑞典)、2019年(6月)造口装置计划表(Stoma Appliance Scheme Schedule,澳大利亚)20,Sistema Socio Sanitario - Regione Lombardia(ATS Milano Città Metropolitana)(意大利),以及2019年(1月)Produkt - og Prisliste Refusjonsberettiget etter §5-14 Medisinsk Forbruksmateriell ved Stomi(挪威)。除英国外,假设CIB造口袋系统的费用与SoC系统的费用相当。所有相关参数的数值请参见附录A。
造口附件(如平面环形圈、造口带、粘胶去除剂喷剂)的使用是基于ADVOCATE的信息,除非可获得更多相关特定国家的数据(表2)。根据假设的使用每种附件的患者百分比以及相应的单位数量和费用,通过“平均附件使用情况”记录附件使用情况。假设附件的使用取决于造口袋系统的每周更换频率。
表2.所用附件(按国家划分)
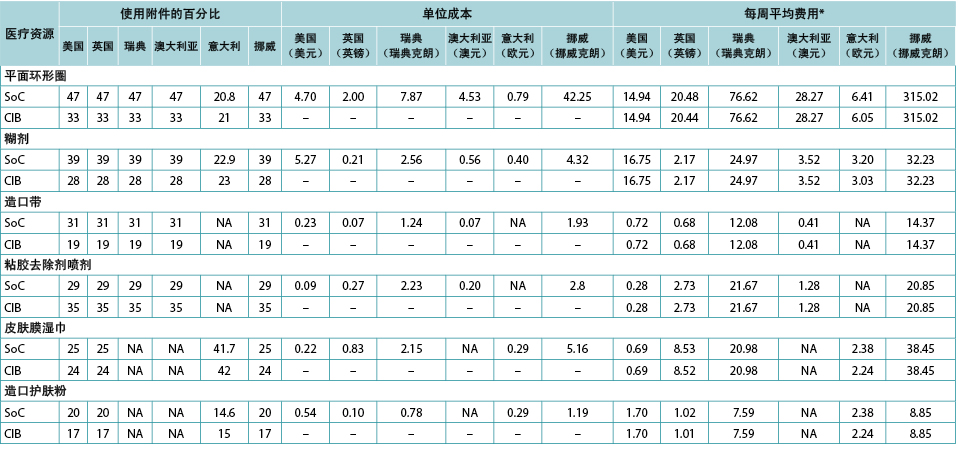
*使用每周更换造口系统的平均次数计算,分别按接受一件式和两件式系统的比例加权计算。
PSC发生率
与ADVOCATE一致,研究者假设55%的SoC患者和41%的CIB患者会发生PSC;PSC的严重程度分布取自ADVOCATE(图2)。由于随访时间相对较短,未使用ADVOCATE来估计第二次发生PSC的概率。研究者任意假设10%的CIB患者会发生第二次PSC,ADVOCATE中观察到的5%的风险差异保持不变,因此15%的SoC患者会发生第二次PSC。研究者还假设,在第一次发生PSC后增加使用附件将使随后发生PSC的风险降低50%(即SoC为7.5%;CIB为5%)。第二次PSC的严重程度取决于第一次PSC的严重程度(表3)。
图2.PSC严重程度分布(按所使用的屏障产品)
表3.基于第一次PSC的严重程度,第二次PSC的严重程度分布
根据ADVOCATE,假设轻症病例(ADVOCATE定义为变色、糜烂、组织过度生长[DET]评分<4)的PSC缓解时间为18天,中症病例(4≤DET<7)和重症病例(DET≥7)为33天。假设缓解时间与屏障产品的选择无关。在PSC期间使用各种医疗保健服务的模式是基于ADVOCATE的信息;虽然没有对一件式造口袋系统进行评价,但研究者假设这些屏障产品的性能与两件式造口袋系统类似。根据ADVOCATE,研究者假设CIB患者使用造口袋用品的情况为:轻症PSC患者的使用增加29%,中症PSC患者增加83%,重症PSC患者增加83%;对于SoC患者,相应增加率分别为64%、49%和49%。研究者还假设每个国家的PSC管理相似(表4)。
表4.PSC期间医疗保健服务的使用和费用(按PSC严重程度、使用的屏障产品和国家划分)
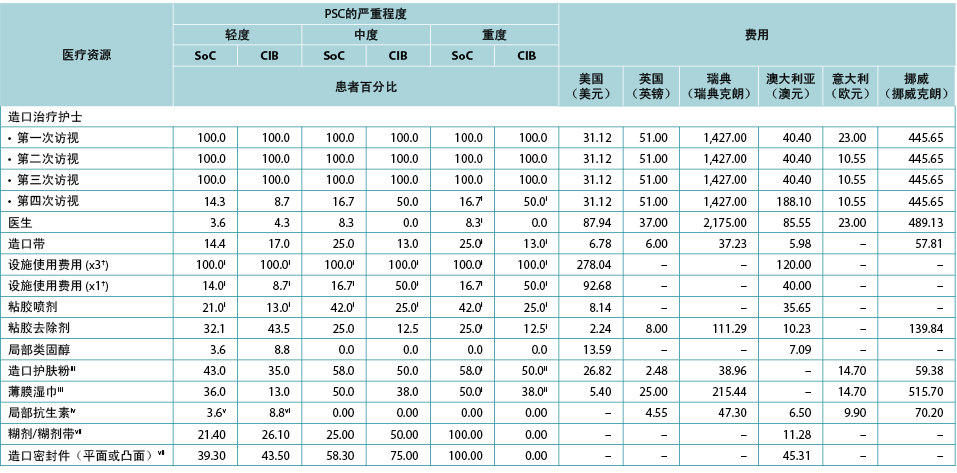
† 设施使用费用(×3)是与前三次STN访视有关的设施使用费用。设施使用费用(×1)是与第四次STN访视有关的设施使用费用。
ii 英国、瑞典、挪威和意大利为0%
ii 英国、瑞典、挪威和意大利为100%
iii 澳大利亚为0%
iv 美国为0%;表中的数值为英国、瑞典、挪威和意大利的数值
V 澳大利亚为7.1
vi 澳大利亚为8.7
vii 仅限澳大利亚
研究者假设美国有149,000例,英国有29,000例,瑞典有6,900例,澳大利亚有9,000例,意大利有17,000例,挪威有3,700例造口患者。在美国,假设造口患者加入了由58,400,000名成员组成的医疗保险计划中;估计的计划规模仅限于美国,因为美国的支付者倾向于根据每人每月(PMPM)的费用来考虑预算影响估计,该估计是用预期费用除以计划成员的总数,然后将所得商数除以12得出。特定国家对人口规模变化的估计(包括计划会员和造口患者的数量)如表5所示,以及假设的医疗费用年通货膨胀率。
表5.特定国家对人口规模变化的估计(包括计划成员和造口患者数量)和假设的医疗费用年通货膨胀率:5年分析假设
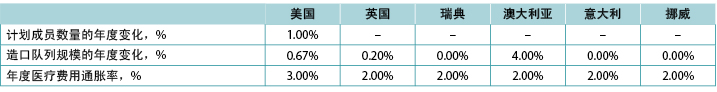
注:正值表示预计增加;负值表示预计减少
数据分析
该模型生成了两种情景下预期PSC的预期总人数和相应的预期造口相关费用,即PSC相关护理加上造口相关护理。通过从SoC情景中的预期总费用减去CIB情景中的预期总费用来估计1年的预算影响。研究者交替计算了预算影响的估计值,假设CIB的增加率为5%、10%、15%、20%和25%(均与SoC情景的0%相比)(表6)。
表6.不同CIB情景下的1年预算影响结果
* 基于一个拥有58,400,000名成员的计划。
注:负值表示预计节省的费用。
本研究对CIB的5年预期预算影响进行了探讨,并考虑了费用通胀和造口队列规模的年度变化;此外,针对美国,研究者估计了医疗保险计划参保人数的年度变化(表5)。研究者还改变了CIB的增加率,假设在CIB情景下的第一年有5%的患者使用这些屏障产品,第二年有7.5%,第三年有10.0%,第四年有10.0%,第五年有10.0%(均与SoC的0%相比)(表7)。
表7.预计的5年内CIB的年度预算影响
* 由于通货膨胀和对队列规模的假设,SoC情景下的医疗费用每年均在增加。
† 在所述年份,假设所有未假定使用CIB的患者均使用SoC屏障产品。
‡ 基于一个拥有58,400,000名成员的计划。
注:负值表示预计节省的费用。
研究者进行了一项敏感性分析,其中将PSC费用修改为Taneja及其同事21在美国综合医疗系统中发现的造口患者的回顾性研究中报告的费用;他们的研究结果表明,发生PSC的患者在120天内的所有原因的医疗费用平均比未发生PSC的患者多8,031美元(58,329美元与
50,298美元;P=0.251)21。在这个分析中,研究者使用模型估计了PSC和CIB队列中的PSC发生率,并使用这些比例分别计算了假设使用SoC和CIB的患者的平均费用。然后研究者将这些费用分别乘以SoC和CIB的相应市场份额,以计算CIB的预期预算影响。由于费用和利用率估计的来源,这一分析仅限于美国。
为研究模型输出对不同参数数值的敏感性,研究者还进行了确定性敏感性分析
(DSA)。在这些分析中,每个模型参数分别变化至其95%置信区间(CI)的下限和上限值。
结果
1年模型
在1年内,SoC情景下的预期造口相关费用总额在美国为4.032亿美元,英国为7050万英镑,瑞典为1.399亿瑞典克朗,澳大利亚为2560万澳元,意大利为3380万欧元,挪威为9730万挪威克朗;对于CIB情景(假设每个国家有20%的患者使用CIB替代SoC;80%使用SoC),相应的数值分别为3.966亿美元、7010万英镑、1.380亿瑞典克朗、2520万澳元、3360万欧元和9570万挪威克朗。因此,预计与CIB相关的节省费用在美国为670万美元,在英国为40万英镑,在瑞典为180万瑞典克朗,在澳大利亚为40万澳元,在意大利为20万欧元,在挪威为150万挪威克朗。由于预计使用CIB会节省费用,预计在美国相应的PMPM影响也会节省费用,但由于假设的计划成员数量众多,影响相对较小(表6)。
5年模型
五年分析得出的费用节省情况为,在美国从第1年的170万美元到第5年的400万美元,在英国从第1年的10万英镑到第5年的20万英镑,在瑞典从第1年的50万瑞典克朗到第5年的120万瑞典克朗,在澳大利亚从第1年的9万澳元到第5年的30万澳元,在意大利从第1年的6万欧元到第5年的30万欧元,以及在挪威从第1年的40万挪威克朗到第5年的100万挪威克朗(表7)。在较长时期内,在相对有限的人群中使用CIB(即在任何给定年份中最多占所有符合条件的造口患者的10%),造口相关护理的预期节省费用为:在美国为15,620,684美元,在英国为965,616英镑,在瑞典为4,613,414瑞典克朗,在澳大利亚为1,042,678澳元,在意大利为560,695欧元,在挪威为3,805,873挪威克朗。
确定性敏感性分析
每个国家对预算影响结果最为敏感的20个变量如附录B的图B1-B6中所示,即每个国家一个图。无论在哪个国家,对预算影响影响最大的变量是使用单位成本相对较高的造口袋用品和附件的患者百分比,以及在使用SoC屏障产品的情况下每年发生PSC的概率。在美国和澳大利亚,在所有进行的DSA中,CIB仍节省了费用;在其他国家,除了一种“极端”情景(将使用更昂贵的造口袋用品或附件的患者百分比设定为SoC的每周费用的95% CI下限值和CIB的95% CI上限值)外,在所有敏感性分析中预计CIB均可节省费用。在这种极端情景下,预计预算增长低于SoC情景下预计的年度医疗费用的1%
(英国为207,042英镑,瑞典为116,916瑞典克朗,意大利为293,897欧元,挪威为112,709挪威克朗)。在所有受评价的国家中,当使用SoC的PSC概率设定为其95% CI下限值,且CIB的相应估计值设定为其95% CI上限值时,预计CIB会节省费用。
情景分析
当研究者使用造口手术后120天内美国真实世界数据所估计的费用投入替换ADVOCATE得出的费用投入时,所得到的与增加使用CIB相关的预算节约估计值大于在基础情况中得到的估计值(表8)。
表8.预计的与使用CIB相关的1年预算影响和美国患者的真实世界医疗费用
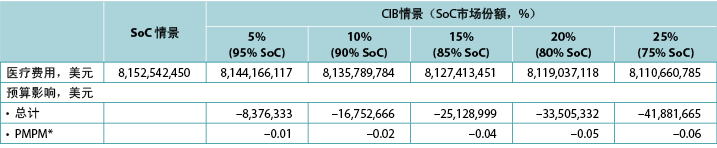
* 基于一个拥有58,400,000名成员的计划。
讨论
研究结果表明,使用CIB替代其他皮肤屏障产品有望在1年内为支付者节省费用。预计的节省费用幅度取决于使用CIB替代其他皮肤屏障产品的造口患者的百分比。美国的影响估计值最高(从5% CIB的170万美元到25% CIB的830万美元),挪威的影响估计值最低(从5% CIB的381,008挪威克朗[43,321美元]到25% CIB的1,905,042挪威克朗[216,603美元])22。美国的估计值远高于其他所述国家的估计值,这可能是由于与本评价中包括的其他国家相比,美国的医疗费用(包括附件)相对较高。预计CIB会降低所有六个被评估国家的医疗费用(即节省费用)。
敏感性分析的结果相当稳健。预算影响的5年预测受CIB市场份额假设的影响最大,但仅通过分别增加造口患者的人数和/或医疗费用便预测到为支付者节省了额外费用。同样,使用PSC而不是ADVOCATE的美国真实世界费用(即12周内约8,000美元与36.46美元)的情景分析结果也预测到,相对于基本情况,所有情景下(相对于SoC)的成本节约均有所增加,而不考虑假设的CIB增加。然而,这种情景包括所有原因的医疗费用,而不仅仅是造口护理的具体费用。不出所料,研究者发现CIB在几乎所有的DSA情景中均可节省费用,模型对使用相对昂贵的造口袋用品和附件的患者百分比以及PSC的发生率最为敏感。在一个“极端”示例中,使用CIB预计会增加总费用,由此产生的预算影响代表了年度医疗费用的小幅增加。在所有被评估的国家中,研究结果是一致的。
虽然药品的经济价值(在成本效益和预算影响方面)已被评估了几十年,但相对而言,对医疗器械的评估较少。这似乎有点违背常理,因为上市的器械数量远高于药品的数量。2012年,欧洲有超过10,000份医疗器械的专利申请,大约是药品的两倍23。与成本效益分析(侧重于评估技术在患者层面的获益)相比,预算影响分析研究支付者的承受能力。研究者认为承受能力问题也同样重要。事实上,评估预算影响是“医疗技术综合经济评估的一个“重要”部分”24。
这个问题在造口等领域可能更为重要,因为在这些领域,临床护士和其他医护人员通常肩负着双重且经常相互竞争的任务,既要提供优质护理,又要控制费用。因此,使用基于随机试验和其他良好研究获得的证据的经济模型是专业医护人员、支付者和其他相关方根据给定产品的疗效和安全性来估计其价值的重要手段。然后,此类模型的结果可用于帮助这些当事方在获得成本效益和提供高质量患者护理方面达成一致。
研究者实施了国际药物经济学与结果研究协会(ISPOR)19规定的预算影响分析良好实践原则,包括研究者基于ADVOCATE(一项随机临床试验)来确定模型中使用的大多数输入值,以及纳入敏感性分析,以更好地了解模型输出对输入和假设的依赖程度。研究者的分析结果与ADVOCATE15和已发表的成本效益模型18的结果一致,并且有证据表明,患者获得的CIB价值也体现为各国支付者节省了费用。
研究局限性
本研究存在一些局限性。首先,与所有经济模型一样,研究的模型对临床实践进行了一定程度的简化,例如将1年内的PSC发生率限制为最多两次,包括在“早期”(即12周)最多发生一次PSC,在
“晚期”(即40周)最多发生一次PSC。目前尚不清楚这些假设在多大程度上充分反映了患者的实际经验。在一个相关问题上,在缺少数据的情况下,研究者任意地(且有些保守地)设定了发生第二次PSC的风险。在PSC风险、皮肤屏障的使用和/或附件的使用方面,该模型在造口类型(如回肠造口、结肠造口)之间也无差异。
CIB的经济和临床影响是基于ADVOCATE的研究结果,包括但不限于PSC的发生率(55%的SoC患者与41%的CIB患者),以及按造口类型划分的患者分布(约三分之一的患者有回肠造口;约二分之一的患者有结肠造口;所有其他患者有尿道造
口)。仍需进行进一步研究以更好地了解CIB在不同人群中的影响,包括按造口类型的分布,以及与入组ADVOCATE的受试者不同的人口统计学数据和/或合并症概况。
研究者还假设,可公开获得的特定国家用于造口相关护理的各种项目的单位成本足以代表每个国家的支付者用于护理造口患者的单位成本。但由于美国有许多不同类型的支付者(如私人商业保险、医疗保险),并且在某些支付者类型内部,各保险公司在报销政策方面具有至少等同的异质性,这一假设对于美国和其他所述国家的真实程度是未知的。
此外,虽然ADVOCATE仅限于使用两件式系统,但研究者假设同时使用一件式和两件式系统,并且CIB的获益在这两类系统中是一致的。研究者还假设PSC的持续时间是固定的。但其他研究报告的缓解时间为7周至3个月以上不等4,5,25;因此,研究者的分析可能低估了PSC的经济结果。但研究者注意到,在这种情况下,预计的与使用CIB替代其他皮肤屏障产品相关的预算影响可能是保守的,换言之,使用CIB所产生的“真实”费用节省幅度可能比本文预计的幅度更高。
结论
在美国、英国、瑞典、澳大利亚、意大利和挪威,使用CIB会使支付者的预期费用降低,预计降低的幅度与假设使用CIB替代SoC的患者百分比直接相关。虽然研究者的研究结果与ADVOCATE和先前的成本效益模型的结果一致,但仍需进一步研究,从而更好地了解在临床实践中使用CIB(相对于其他皮肤屏障产品)所产生的经济结果。
利益冲突
Gary W Inglese和George Skountrianos是Hollister Incorporated的雇员。Ariel Berger和Mustafa Oguz是Evidera Inc.的雇员,该公司为药品、器械、政府和非政府组织提供咨询和其他研究服务。Evidera Inc.收到了Hollister Incorporated提供的与开展本研究和编写本稿件相关的资助。Davide Croce是卡罗•卡塔内奥大学的雇员,其未因开展本研究或编写本稿件收到任何资助。
赞助
本研究的资助由Hollister Incorporated提供。
Author(s)
Ariel Berger* MPH
Executive Director, Integrated Solutions – RWE
Evidera, 500 Totten Pond Road, 5th Floor, Waltham, MA 02451, USA
Email ariel.berger@evidera.com
Gary Inglese RN, MBA
Senior Director, Market Access
Hollister Incorporated, Libertyville, IL, USA
George Skountrianos MS
Statistician, Global Clinical Affairs
Hollister Incorporated, Libertyville, IL, USA
Davide Croce MBA
Aggregate Professor
Research Center in Health Economics, Social and Healthcare Management, Università Carlo Cattaneo–LIUC, Castellanza (Va), Italy
Mustafa Oguz PhD
Senior Research Associate, Data Analytics
Evidera Inc., Hammersmith, London, UK
* Corresponding author
References
- Alvey B, Beck DE. Peristomal dermatology. Clin Colon Rectal Surg 2008;21(1):41–44.
- Doctor K, Colibaseanu DT. Peristomal skin complications: causes, effects, and treatments. Chronic Wound Care Manag Res 2017;2017(4):1–6.
- Rolstad BS, Erwin-Toth PL. Peristomal skin complications: prevention and management. Ostomy Wound Manage 2004;50(9):68–77.
- Herlufsen P, Olsen AG, Carlsen B, et al. Study of peristomal skin disorders in patients with permanent stomas. Br J Nurs 2006;15(16):854–862.
- Meisner S, Lehur PA, Moran B, Martins L, Jemec GB. Peristomal skin complications are common, expensive, and difficult to manage: a population based cost modeling study. PLoS One 2012;7(5):e37813.
- Richbourg L, Thorpe JM, Rapp CG. Difficulties experienced by the ostomate after hospital discharge. J Wound Ostomy Continence Nurs 2007;34(1):70–79.
- Salvadalena GD. The incidence of stoma and peristomal complications during the first 3 months after ostomy creation. J Wound Ostomy Continence Nurs 2013;40(4):400–406.
- Taneja C, Netsch D, Rolstad BS, Inglese G, Lamerato L, Oster G. Clinical and economic burden of peristomal skin complications in patients with recent ostomies. J Wound Ostomy Continence Nurs 2017;44(4):350–357.
- Maeda S, Ouchi A, Komori K, et al. Risk factors for peristomal skin disorders associated with temporary ileostomy construction. Surg Today 2021.
- Shiraishi T, Nishizawa Y, Nakajima M, et al. Risk factors for the incidence and severity of peristomal skin disorders defined using two scoring systems. Surg Today 2020;50(3):284–291.
- Voegeli D, Karlsmark T, Eddes EH, et al. Factors influencing the incidence of peristomal skin complications: evidence from a multinational survey on living with a stoma. Gastrointest Nurs 2020;18(Sup4):S31–S38.
- Jemec GB, Nybaek H. Peristomal skin problems account for more than one in three visits to ostomy nurses. Br J Dermatol 2008;159(5):1211–1212.
- Nichols TR, Inglese GW. The burden of peristomal skin complications on an ostomy population as assessed by health utility and the physical component summary of the SF-36v2®. Value Hlth 2018;21(1):89–94.
- Coderch L, Lopez O, de la Maza A, Parra JL. Ceramides and skin function. Am J Clin Dermatol 2003;4(2):107–129.
- Colwell JC, Pittman J, Raizman R, Salvadalena G. A randomized controlled trial determining variances in ostomy skin conditions and the economic impact (ADVOCATE trial). J Wound Ostomy Continence Nurs 2018;45(1):37–42.
- Hollister Inc. The CeraPlus skin barrier product evaluation: clinicians’ feedback; 2017 [cited 2017 Nov 8]. Available from: https://www.hollister.no/-/media/files/pdfs-for-download/ostomy-clinical-evaluations-and-case-studies-pdfs/ceraplus-product-evaluation-113015.ashx.
- Hollister Inc. CeraPlus skin barrier; 2017 [cited 2020 Apr 21]. Available from: https://www.hollister.com/en/ceraplus.
- Berger A, Inglese G, Skountrianos G, Karlsmark T, Oguz M. Cost-effectiveness of a ceramide-infused skin barrier versus a standard barrier: findings from a long-term cost-effectiveness analysis. J Wound Ostomy Continence Nurs 2018;45(2):146–155.
- Mauskopf JA, Sullivan SD, Annemans L, et al. Principles of good practice for budget impact analysis: report of the ISPOR Task Force on good research practices – budget impact analysis. Value Hlth 2007;10(5):336–347.
- Australian Department of Health. Stoma Appliance Scheme – schedule; 2017 [cited 2017 Nov 8]. Available from: http://www.health.gov.au/internet/main/publishing.nsf/Content/AB1C0973EEA98E14CA257BF0001E01C4/$File/sas-schedule-1-july-2017-full.pdf.
- Taneja C, Netsch D, Rolstad BS, Inglese G, Eaves D, Oster G. Risk and economic burden of peristomal skin complications following ostomy surgery. J Wound Ostomy Continence Nurs 2019;46(2):143–149.
- ExchangeRates.org.uk. Euro to US dollar spot exchange rates for 2019; 2019 [cited 2020 Apr 21]. Available from: https://www.exchangerates.org.uk/EUR-USD-spot-exchange-rates-history-2019.html.
- Craig JA, Carr L, Hutton J, Glanville J, Iglesias CP, Sims AJ. A review of the economic tools for assessing new medical devices. Appl Health Econ Health Policy 2015;13(1):15–27.
- Neumann PJ. Budget impact analyses get some respect. Value Hlth 2007;10(5):324–325.
- Persson E, Berndtsson I, Carlsson E, Hallen AM, Lindholm E. Stoma-related complications and stoma size – a 2-year follow up. Colorectal Dis 2010;12(10):971–976.
Appendix A. Pouching Supply Use
With the exception of the UK, the costs of CIB pouching systems were assumed equivalent to those of SoC systems. In the UK, the per package cost of one-piece flat closed, convex closed, flat drainable, and convex drainable systems were £87.75, £98.70, £97.95 and £135.75 for SoC; and £88.68, £99.90, £106.42 and £144.31 for CIB, respectively. The baseplate and pouch package cost for two-piece systems were £20.00 and £1.69, respectively, for both SoC flat and convex systems, £22.24 and £1.69 for CIB flat systems, and £22.72 and £1.69 for CIB convex systems. Pouching supply use parameters are provided in Tables A1 to A6 below.
Table A1. Pouching supply use: US
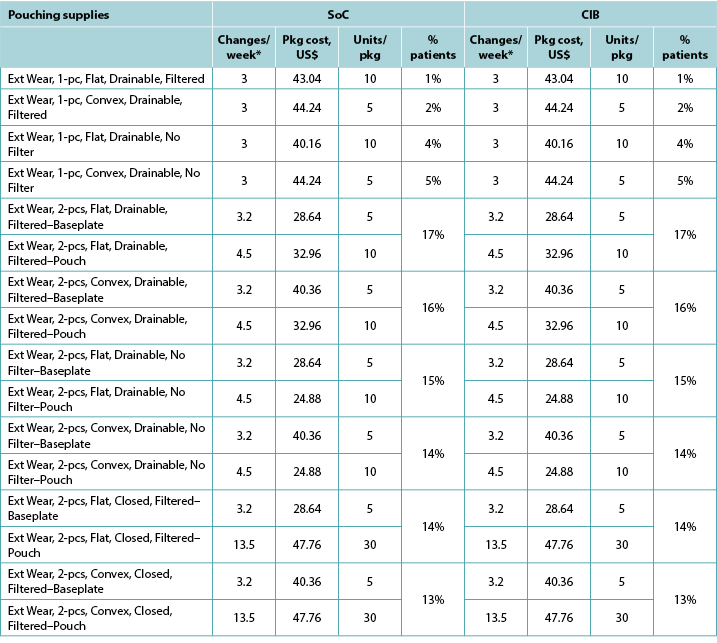
Table A2. Pouching supply use: UK
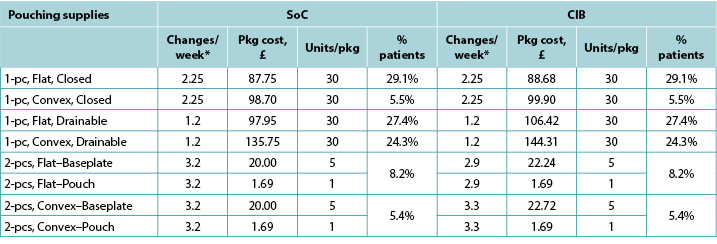
Table A3. Pouching supply use: Sweden

Table A4. Pouching supply use: Australia
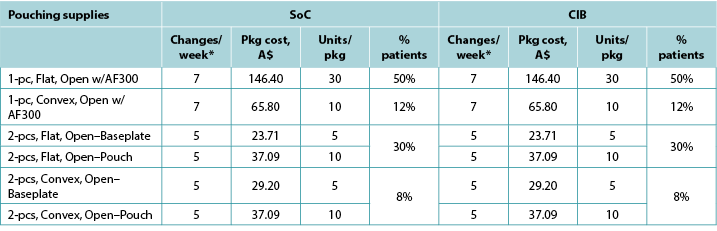
Table A5. Pouching supply use: Italy
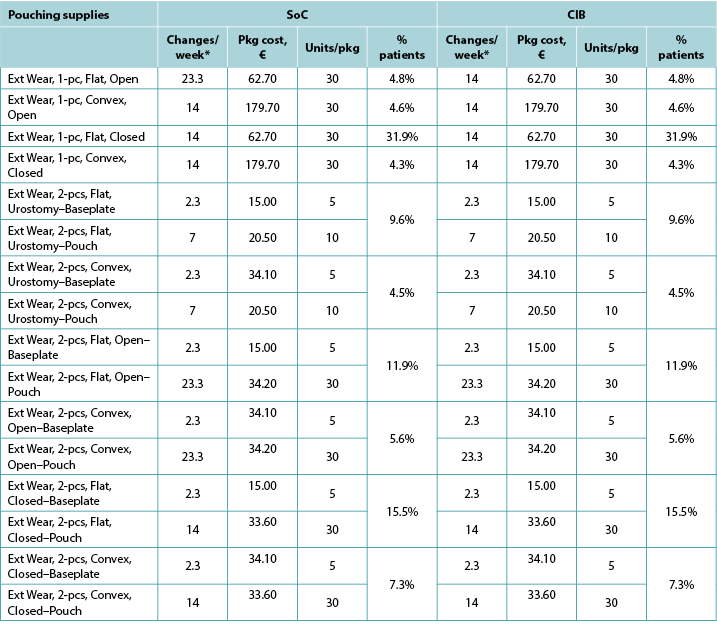
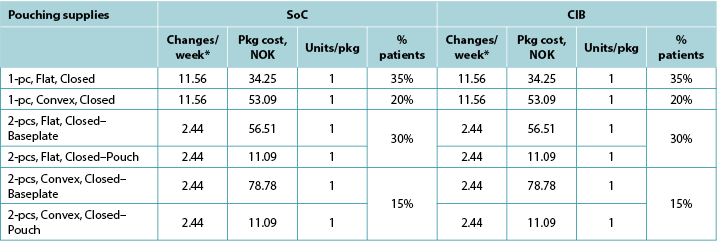
Table A6. Pouching supply use: Norway
Appendix B. DSA of Expected Budget Impact, by Country
Expected budget impact associated with the use of a CIB versus SoC among patients within 12 weeks of faecal ostomy surgery in Australia, Italy, Norway, Sweden, the UK and the US.
Please note: Figure B1. DSA of expected budget impact: US, was not available at time of publishing
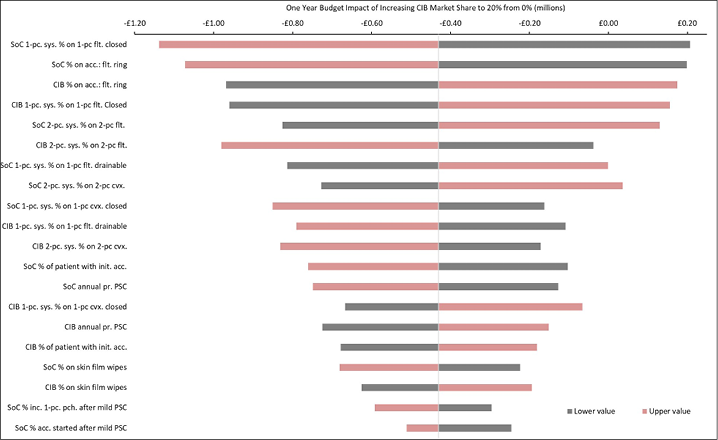
Figure B2. DSA of expected budget impact: UK
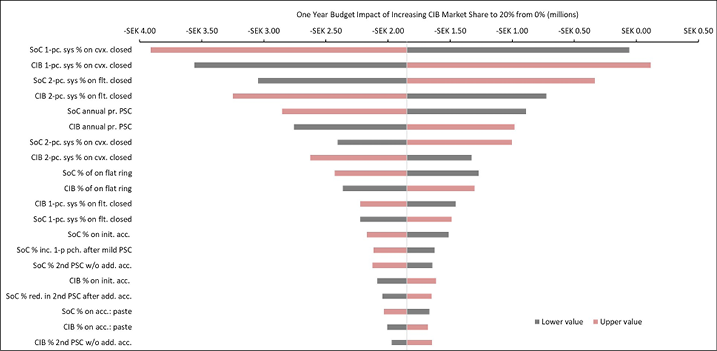
Figure B3. DSA of expected budget impact: Sweden
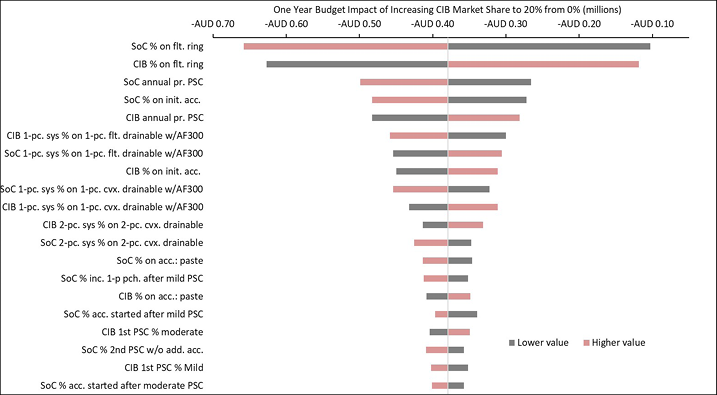
Figure B4. DSA of expected budget impact: Australia
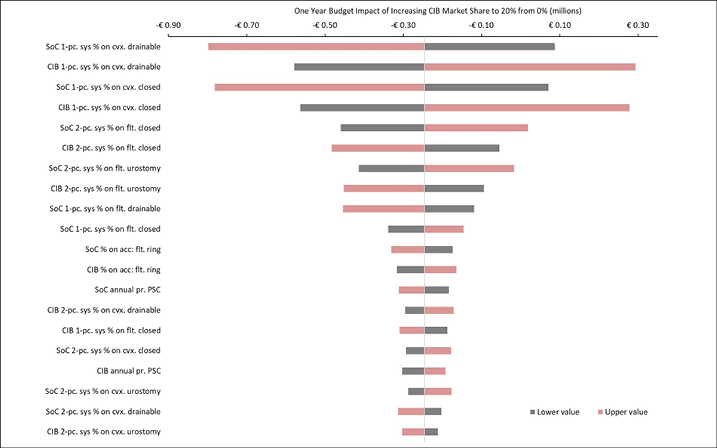
Figure B5. DSA of expected budget impact: Italy
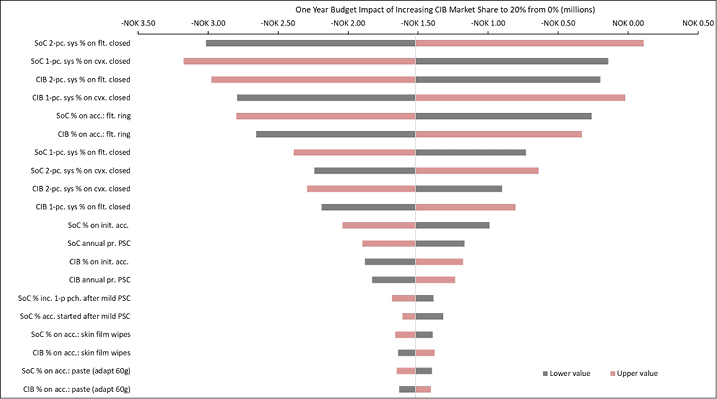
Figure B6. DSA of expected budget impact: Norway