

Volume 42 Number 4
Statistical testing in wound care
John Stephenson
Keywords inferential statistical tests, p value, confidence intervals, odds ratio
For referencing Stephenson J. Statistical testing in wound care. WCET® Journal 2022;42(4):38-40
DOI
https://doi.org/10.33235/wcet.42.4.38-40
Submitted 6 November 2022
Accepted 1 December 2022
Wound care studies generally yield quantitative data; and that data require some form of analysis. Almost all studies include a descriptive summary of participants, as discussed in my previous article1. However, many studies also require some form of inferential statistical testing; usually if the intention is to generalise findings from the sample to a population.
Different study designs require different testing methods, although the basic aim in most cases is the same. This is to assess the significance of the effect of interest; that is, to establish whether any effect we see in our sample data is a reflection of the state of affairs in the parent population, or likely to be nothing more than random variation in our data. An effect could be an observed difference between study groups (such as amount of biofilm present in a control group and a group where patients are treated with an anti-microbial dressing), the difference between a measure taken at baseline and post-intervention from a single patient group (such as pain levels during and after surgery), an observed relationship between two variables (such as the extent of mobile health technology use and wound care knowledge) or many other quantities.
Establishment of statistical significance requires a test of a hypothesis. We usually test a null hypothesis (of no effect); for example, that the difference in means in the population is zero. Miller et al2 conducted a pilot single-blinded randomised controlled trial (RCT) to examine concordance with and acceptability of electric stimulation therapy (EST) in patients with venous leg ulcers (VLUs) who had not tolerated moderate to high compression. The treatment was tested against the null hypothesis of no effect; i.e. that concordance with the total recommended treatment time under control treatment or under EST was the same. Lenselink and Andriessen3 measured (among other quantities) the percentage of granulation tissue and yellow tissue in a cohort study on the efficacy of a polyhexanide-containing biocellulose dressing in 28 patients, testing several hypotheses relating to differences in patient outcomes between baseline and 24 weeks. In a study of diabetic and non-diabetic patients, Gunes et al4 analysed several biomarkers, primarily galectin-3 (which promotes angiogenesis and new vessel formation) and tested several hypotheses relating to relationships between galectin-3 and various other biomarkers.
Significance is quantified using the familiar (if not widely understood) p-value, which is a conditional probability: the probability that observed results, or something more extreme, would have been obtained, given that the null hypothesis is true. In everyday parlance it is referred to loosely as ‘the chance of a chance’: that is, the probability that our data has fallen the way it has just as a result of natural variation and not because an effect actually exists. Conventionally, a p-value below 0.05 (5%) is taken as indicating an outcome of statistical significance (at the 5% significance level) and a consequential rejection of the null hypothesis of no effect. The study of Miller et al yielded a p-value of 0.671 for its primary outcome; indicating insufficient evidence for a difference between treatment groups. The study of Lenselink and Andriessen yielded a p-value reported to be less than 0.04 for a test comparing the mean percentage of granulation tissue from baseline to 24 weeks post-treatment; indicating evidence for a treatment effect. The study of Gunes et al yielded a p-value of less than 0.001 in a test for correlation between the galectin-3 and C-reactive protein biomarkers, indicating strong evidence for a significant relationship between these biomarkers.
The RCT conducted by Miller et al and the test of changes from baseline conducted by Lenselink and Andriessen are examples of grouped study designs: an unpaired study, in which two unrelated study groups are compared, in the case of Miller et al and a paired study design, in which the measures are taken on two occasions from the same group of patients, in the case of Lenselink and Andriessen (the word ‘paired’ refers to the fact that each patient contributes a pair of readings, not that a pair of groups is involved). Another variant of this study arises when measures are taken from patients matched on demographic or health-related variables. The study of Gunes et al is an example of a correlational design using ungrouped data. These three designs are probably the most common choices of study design in wound care, although various other study types, which also aim to infer results from sample data to a population may be found, including for example tests of agreement, screening/diagnostic studies, survival analysis and meta-analysis.
Numerical outcomes in unpaired studies can be compared using the independent samples t-test, or, if more than two groups are involved, a test such as analysis of variance (ANOVA). Categorical outcomes are usually analysed using the chi-squared test for association. For the paired study design, the standard analysis technique is the paired samples t-test or the repeated measures ANOVA. Correlational studies are usually quantified via Pearson’s correlation coefficient, and may be extended into a linear regression setting. All these procedures are parametric procedures which make certain distributional assumptions about the data; if these assumptions are not fulfilled, corresponding non-parametric techniques, such as the rank-sum test, signed ranks test, evaluation of Spearman’s rank correlation coefficient or bootstrapping procedures can often work quite well. All procedures may be easily implemented using standard statistical software and all will yield an assessment of statistical significance as measured by the p-value and given by the software.
While the p-value facilitates an inference of statistical significance or otherwise, it does not give us a measure of precision in our results. This is another side to inferential testing. We may find in our sample an effect of a given size, but it would not be realistic to expect that an effect of precisely that magnitude exists in the wider population. While we will never know what the size of the population effect actually is, it is possible to derive a confidence interval (CI), also known as an uncertainty interval, for it. This is often interpreted loosely as the range of values within which we can state to a certain degree of confidence (conventionally 95%) that a population value lies. More formally, if we were to repeat the procedure many times, then the range of values determined each time would contain the true population parameter on 95% of occasions.
CIs do not quantify the strength of evidence against the null hypothesis, as the p-value does, but instead give a measure of the precision of an estimate (for example, the difference between, or ratio of, the mean values in treatment groups). Nowadays CIs (and the estimate of effect around which they are fitted) are increasingly reported alongside p-values in statistical testing and appear to many to be more informative and easier to understand. While they do not form part of a hypothesis test, most statistical software will automatically report a CI as a by-product of the hypothesis test output.
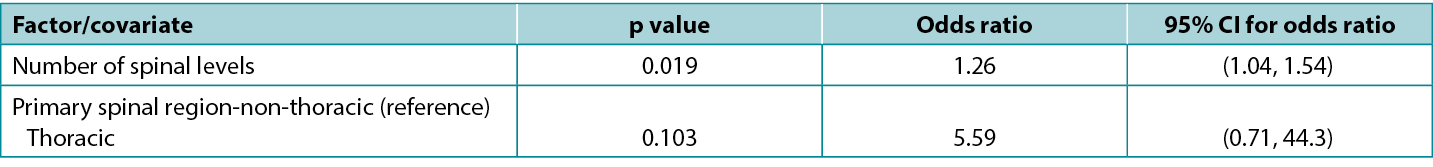
There is an exact correspondence between CIs and the corresponding p-value: a 95% CI that excludes the key value 0 (for a difference between study groups) or 1 (for a ratio between study groups) corresponds to a significant effect at the 5% significance level (i.e. a p-value that is less than 0.05). Conversely, a 95% CI that includes a key value corresponds to a p-value that is statistically non-significant at the 5% significance level (i.e. is 0.05 or greater). Atkinson et al5 investigated the effect of various factors on risk of surgical site infection during spinal surgery and in a typical presentation of tabulated results (below), reported statistics from a model including both p-values and CIs. Note that the spinal levels factor, which is significant according to the p-value (0.019), has an odds ratio with an associated CI of 1.04 to 1.54, which excludes the key value (for a ratio) of 1; while the spinal region factor, which is non-significant according to the p-value (0.103), has an odds ratio with an associated CI of 0.71 to 44.3, which includes the key value. This table is also a good example of how an effect of relatively small magnitude (each additional spinal level is associated with a 26% increase in odds of infection) may be significant; whereas an effect of large magnitude (surgery performed in the thoracic, rather than non-thoracic region is associated with about a fivefold increase in odds of infection) may be non-significant.
Table 1: extract from data table reported by Atkinson et al5
Selection of an appropriate statistical test for a given study design is not always straightforward and requires careful consideration of study parameters. No single test is suitable for all types of studies. For grouped studies, such as the unpaired and paired designs discussed above, we may need to consider, for example, the number of groups, the size of the groups, the distribution of data, the independence of units and the presence or absence of confounding factors in selecting a test. For ungrouped studies, such as correlational studies, we may wish to consider whether our data is in the form of raw data or rank orderings; and for ungrouped studies assessing multiple factors, we may wish to consider whether we are potentially overfitting our data (modelling noise rather than signal) by attempting to analyse too many factors for a sample of a given size.
Special measures are needed for complex designs: for example when data is clustered (such as patients within hospital wards, or anatomical sites within patients); when multiple tests are being conducted (such as may arise in studies with multiple outcome measures, where the key treatment variable has multiple levels, or where separate analyses are conducted on sub-groups of individuals and/or at multiple time points); when outcomes are not known exactly (such as when an outcome is the time to an adverse event in patients who are monitored infrequently); when a series of observations are made on the same patients; or when it is required to determine a synthesised estimate of effect from multiple studies. Certain data features, such as the presence of extensive missing or invalid values or outliers may also lead to a requirement for additional statistical processes. In all such situations it is recommended that the advice of a biomedical statistician is sought.
伤口护理中的统计检验
John Stephenson
DOI: https://doi.org/10.33235/wcet.42.4.38-40
伤口护理研究通常会产生定量数据;并且数据需要进行某种形式的分析。正如笔者在之前的文章1中所讨论的,几乎所有的研究都包括参与者的描述性总结。然而,许多研究也需要某种形式的推断统计检验;通常是为了将样本的结果推广到总体。
不同的研究设计需要不同的检验方法,尽管在大多数情况下基本目的是相同的。这是为了评估关注效应的显著性;也就是说,确定我们在样本数据中观察到的任何效应是否反映了全及总体的状况,还是可能只是我们数据中的随机变化。效应可以是观察到的研究组之间的差异(例如对照组中和使用抗菌敷料治疗的患者组中存在的生物膜量)、单个患者组中基线指标值和干预后指标值的差异(例如术中和术后的疼痛水平)、观察到的两个变量之间的关系(例如移动医疗技术的使用程度和伤口护理知识)或者许多其他数量。
建立统计学显著性需要对假设进行检验。我们通常检验零假设(无效应);例如,总体中的平均值差异为零。Miller等人2进行了一项初探性单盲随机对照试验(RCT),以检查电刺激疗法(EST)在不耐受中高度压迫的下肢静脉性溃疡(VLU)患者中的一致性和可接受性。根据无效应的零假设对治疗进行检验,即与对照治疗或EST下的总建议治疗时间的一致性相同。Lenselink和Andriessen3在一项关于含聚己酰胺的生物纤维素敷料用于28名患者的疗效的队列研究中,测量了肉芽组织和黄色组织的百分比(以及其他数量),检验了关于基线与24周之间患者结局差异的几种假设。在一项对糖尿病和非糖尿病患者的研究中,Gunes等人4分析了几种生物标志物,主要是galectin-3(促进血管生成和新血管形成),并检验了与galectin-3和各种其他生物标志物之间关系相关的几种假设。
使用熟悉的(如果不是被广泛理解的)p值对显著性进行量化,它是一个条件概率:假定零假设为真,所观察到的结果或更极端的结果得到的概率。在日常用语中,它被粗略地称为“偶然的机会”:即我们的数据变成其它所具有的方式的概率,仅仅是自然变化的结果,而不是因为实际上存在的效应。通常,p值低于0.05(5%)则视为具有统计学显著性(在5%显著性水平),并因此拒绝无效应的零假设。Miller等人的研究得出其主要结果的p值为0.671,表明治疗组之间存在差异的证据不充分。在Lenselink和Andriessen的研究中,比较从基线到治疗后24周肉芽组织的平均百分比的检验得到的p值小于0.04,表明了治疗效应的证据。在Gunes等人的研究中,galectin-3和C反应蛋白生物标志物之间的相关性检验中得到的p值小于0.001,表明了这些生物标志物之间存在显著关系的有力证据。
Miller等人进行的RCT 和Lenselink和Andriessen进行的较基线变化检验是分组研究设计的示例:在Miller等人的研究中,是对两个不相关的研究组进行比较的非配对研究;在Lenselink和Andriessen的研究中,是对同一组患者进行两次测量的配对研究设计(“配对”一词是指每位患者贡献一对读数,而不是组的配对)。当对人口统计学或健康相关变量匹配的患者进行测量时,出现了这项研究的另一种变体。Gunes等人的研究是使用未分组数据的相关性设计的一个示例。这三种设计可能是伤口护理研究设计的最常见选择,但也可以找到各种其他研究类型,其目的也是从样本数据推断总体结果,包括一致性检验、筛选/诊断研究、生存分析和荟萃分析。
非配对研究的数值结果可以使用独立样本t检验进行比较,或者如果涉及两个以上的组,则可以使用方差分析(ANOVA)等检验进行比较。分类结果通常使用相关性卡方检验进行分析。对于配对研究设计,标准分析技术是配对样本t检验或重复测量ANOVA。相关性研究通常通过Pearson相关系数进行定量,并可以扩展到线性回归设置。所有这些过程都是参数化过程,对数据做出某些分布假设;如果不满足这些假设,相应的非参数技术,如秩和检验、符号秩检验、Spearman秩相关系数评价或Bootstrapping法通常可以很好地发挥作用。所有过程都可以使用标准统计软件轻松实施,并且所有过程都会产生通过p值测量和软件给出的统计学显著性评估。
虽然p值有助于推断统计学显著性或其他方面,但它并不能衡量我们结果的精确度。这是推断检验的另一个方面。我们可以在我们的样本中发现给定的效应量,但期望在更广泛的总体中存在精确到该量的效应是不现实的。虽然我们永远不会知道总体效应量的实际大小,但有可能推导出置信区间(CI),也称为不确定性区间。这通常可以宽泛地解释为一个值的范围,我们可以在一定置信度(通常为95%)下声明总体值在这个范围内。更正式地说,如果我们多次重复该过程,则每次确定的值范围将在95%的情况下包含的真实的总体参数。
CI并不像p值那样量化反映零假设的证据强度,而是给出估计值的精确度指标(例如,治疗组中平均值之间的差异或比值)。如今,CI(以及与之拟合的效应的估计值)在统计检验中越来越多地与p值一起报告,并且在许多人看来似乎可以提供更多信息且更容易理解。虽然它们不构成假设检验的一部分,但大多数统计软件会自动报告CI,作为假设检验输出的副产物。
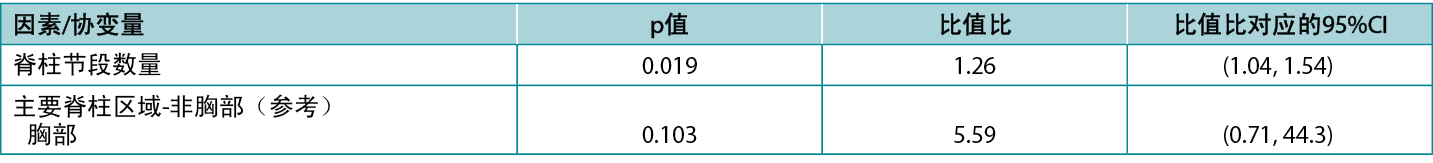
CI与相应的p值之间存在精确的对应关系:排除关键值0(研究组之间的差异)或1(研究组之间的比值)的 95%CI对应于5%的显著性水平下的显著效应(即p值<0.05)。相反,包含关键值的95%CI对应于在5%显著性水平下无统计学显著性的p值(即0.05或更高)。Atkinson等人5研究了在脊柱手术期间各种因素对手术部位感染风险的影响,并在典型的表格结果呈现中(如下)报告了包括p值和CI在内的模型统计。请注意,根据p值(0.019),脊柱节段因素具有显著性,其比值比相关CI为1.04至1.54,排除了关键值(比值)1;而根据p值(0.103),脊柱区域因素不具有显著性,其比值比相关CI为0.71至
44.3,包括关键值。该表也是相对较小幅度(每増加一个脊柱节段,感染几率増加26%)的效应可能具有显著性的一个很好的示例;而较大幅度(在胸部而不是非胸部区域进行手术,与感染几率増加约五倍相关)的效应可能不具有显著性。
表1:Atkinson等人5报告的数据表摘录
为给定的研究设计选择适当的统计检验并不总是简单的,需要仔细考虑研究参数。没有任何一项检验适用于所有类型的研究。对于分组研究,例如上文讨论的非配对和配对设计,我们在选择检验时可能需要考虑,例如,组的数量、组的大小、数据分布、单位独立性以及是否存在混杂因素。对于未分组的研究,例如相关性研究,我们可能希望考虑我们的数据是原始数据形式还是秩排序形式;对于评估多个因素的未分组研究,我们可能希望考虑我们是否可能因尝试分析给定样本量的过多因素而过度拟合我们的数据(模拟噪声而不是信号)。
复杂设计需要特殊指标:例如当数据聚集时(如医院病房内的患者或患者体内的解剖部位);当进行多项检验时(例如,可能在具有多个结局指标的研究中出现,其中关键治疗变量具有多个水平,或对个体亚组和/或在多个时间点进行单独分
析);当结局不准确时(例如,当结局是很少监测的患者发生不良事件的时间时);当对相同患者进行一系列观察时;或者当需要确定多项研究的综合效应估计值时。某些数据特征,例如大量缺失值或无效值或离群值的存在,也可能导致需要额外的统计过程。在所有这些情况下,建议寻求生物医学统计学家的建议。
Author(s)
John Stephenson
PHD FRSS(GradStat) CMath(MIMA)
Senior Lecturer in Biomedical Statistics
University of Huddersfield, United Kingdom
Email J.Stephenson@hud.ac.uk
References
- Stephenson, J. (2022). Descriptive presentation of wound care data. World Council of Enterostomal Therapists Journal. 42, 3, p. 30-33
- Miller C, McGuiness W, Wilson S, Cooper K, Swanson T, Rooney D, Piller N, Woodward M (2017). Concordance and acceptability of electric stimulation therapy: a randomised controlled trial. Journal of Wound Care Vol. 26, No. 8. https://doi-org.libaccess.hud.ac.uk/10.12968/jowc.2017.26.8.508
- Lenselink E, Andriessen A (2011). A cohort study on the efficacy of a polyhexanide-containing biocellulose dressing in the treatment of biofilms in wounds. Journal of Wound Care 20 (534)
- Gunes EA, Eren MA, Koyuncu I, Taskin A, Sabuncu T (2018). Investigation of galectin-3 levels in diabetic foot ulcers. Journal of Wound Care (27); 12
- Atkinson R, Stephenson J, Jones A, Ousey K. An assessment of key risk factors for surgical site infection in patients undergoing surgery for spinal metastases J Wound Care 2016; 25(S9); S30-S34