Volume 31 Number 4
Characteristics of United States nursing homes with high percentages of stage 2–4 pressure injuries among high-risk nursing home residents with obesity
Holly C Felix, Clare C Brown, Marie-Rachelle Narcisse, Jennifer L Vincenzo,
Jennifer A Andersen, Christine W Bradway, Robert Weech-Maldonado
Keywords pressure injuries, obesity, nursing homes
For referencing Felix HC et al. Characteristics of United States nursing homes with high percentages of stage 2–4 pressure injuries among high-risk nursing home residents with obesity. Wound Practice and Research 2023; 31(4):174-181.
DOI
10.33235/wpr.31.4.174-181
Submitted 18 July 2023
Accepted 9 September 2023
Abstract
Obesity rates in nursing homes (NHs) are increasing. Residents with obesity are at risk for poor outcomes such as pressure injuries (PIs) due to special care needs such as bariatric medical equipment and special protocols for skin care. PIs among resident populations is a sign of poor quality NH care. The purpose of this retrospective observational study was to identify characteristics of NHs with high rates of stage 2–4 PIs among their high-risk residents with obesity. Resident assessment data were aggregated to the NH level. NH structure and process of care and antecedent conditions of the residents and environment measures were used in bivariate comparisons and multivariate logistic regression models to identify associations with NHs having high rates of stage 2–4 PIs among high-risk residents with obesity. We identified three characteristics for which the effect on the odds was at least 10% for clinical significance – for-profit status, large facilities, and the hours of certified nursing assistants (CNAs) per patient day (HRPPD). This study identified several NH characteristics that are associated with higher risk for PIs, which can be targeted with evidence-based interventions to reduce the risk of these adverse safety events occurring.
Introduction
Pressure injuries (PIs) among high-risk nursing home (NH) residents is a quality of care indicator1. PIs are defined as damage to a localised area of skin and/or underlying tissue due to pressure or shearing with pressure2. PIs range in severity based on the depth of the skin damage, ranging from stage 1 (skin redness) to stage 4 (deep wound showing muscle or bone)3. The 2015 Nursing Home Data Compendium reported 5.1% of residents had PIs at stage 2 or greater4. However, recent research has indicated PIs are underreported in NHs in the United States (US)5. PIs can be painful, lower quality of life, and may lead to infections, hospitalisations, higher healthcare costs, and an increased risk of death6,7.
Previous research has noted that being underweight is a risk factor for development of PIs, and obesity reduces the risk8; although a systematic review and meta-analysis found the odds of PIs among persons with obesity (body mass index [BMI] ≥30) versus those who were not obese was not significant9. However, recent research in 2023 has identified a U-shaped relationship between BMI and PIs. Specifically, for every one-unit increase in BMI, the risk of a PI decreased by 8.6% until BMI reached 27.5. For every one-unit increase in BMI after 27.5, the risk of a PI increased by 1.4%10.
US NHs provide long-term care for individuals who have physical or mental functional limitations limiting their ability to perform activities of daily living such as dressing, grooming and toileting and/or perform instrumental activities of daily living such as managing medications, paying bills and cooking. Some NHs provide skilled nursing services after a post-acute care stay. The Centers for Medicare and Medicaid Services regulate US NHs alongside the individual states. Medicare provides payment for skilled NH care after a qualified acute care stay primarily for individuals over the age of 65 years. Medicaid is the primary payer of NH care in the US. It covers the cost of care for individuals who are no longer able to self pay or do not have long-term care insurance.
US NHs are experiencing increasing rates of obesity among their resident populations. By 2015, the obesity rate among NH residents was 28%11,12. If the trend in US NHs follows the trends among the US population13, the obesity rates in NHs are likely to continue to increase. The literature indicates that NH residents with obesity have different care needs such as needing two or more staff to assist them with personal care14,15 and special skin care needs16. Residents with obesity are at risk for atypical PIs resulting from ill-fitting chairs, beds or wheelchairs16,17. Residents with a large abdominal panniculus can also develop PIs in the suprapubic area due to the weight of the panniculus16. These challenges may lead to adverse safety outcomes, including PIs, and are an indicator of poor quality of care.
Cai et al18 found moderate to severe obesity among NH residents increased the odds for PIs by 15%, even after accounting for baseline health conditions and facility-level factors. Cai et al also found increased PIs among residents with moderate-to-severe obesity in NHs with lower levels of certified nursing assistants (CNAs)18.
NH residents with obesity are at increased risk for PIs due to limited mobility, pressure due to excess body weight, and skin shear during movement. Although bony prominences may be padded with adipose tissue, skin folds can present significant pressure risk, including pressure necrosis. Patients weighing more than 300 pounds (136kg) require specialised support surfaces and adequately sized medical equipment to lower the risk of PIs16,19. A federal report on NH quality highlighted the problem of inadequately sized medical equipment; a resident with obesity was admitted to a NH without any PIs. After just 7 days, the resident had four stage 2 PIs, and three stage 1 PIs. The PIs were the result of a bed and mattress being too small to allow sufficient turning of the resident17.
NH residents with obesity are also at an increased risk of developing a PI due to impaired vascularity of adipose tissue in individuals with obesity and decreased independence with mobility. These factors lead to pressure over bony prominences and decreased perfusion of tissue which increase the risk of PI20,21.
We undertook this study to identify characteristics of NHs associated with variation in rates of PIs among their residents with obesity. Previous research in this area examined only one facility level characteristic and focused on individual residents rather than NHs18. Our study focused on NHs and included many facility level characteristics that could affect quality of care, as well as the presence of PIs. We applied Coyle and Battles’ adaptation of Donabedian’s Structure-Process-Outcomes (SPO) model to guide our study. Donabedian’s SPO model suggests the structure of care (organisational characteristics such as profit status) affects the process of care (e.g., use of restraints) which affects the outcomes of care (PIs)22. Coyle and Battles incorporated antecedent characteristics into Donabedian’s model to represent patient/resident characteristics (resident weight at admission) that could affect the process of care and environmental/contextual factors that could affect the structure of care (Medicaid NH payment rates)23. Thus our study fills the gap on NH-related characteristics associated with high rates of PIs among residents with obesity.
Methods
A retrospective observational design was used for this study.
Data source
The 2017–2018 minimum dataset (MDS 3.0) provided resident information. Facility characteristics were drawn from Brown University’s LTCFocus 2017 and the Certification and Survey Provider Enhanced Reporting (CASPER) dataset. County-level information came from County Health Rankings and the Area Health Resource File for 2017. State Medicaid NH 2017 per diem rates were drawn from GenWorth Financial, Inc.
Sample
Quarterly assessments for long-stay (length of stay in the facility ≥100 days) residents with obesity were aggregated to calendar quarters per facility and served as the unit of analysis. Obesity was defined as BMI ≥30, calculating BMI using height and weight measures available in the MDS and the BMI formula (body weight in kilograms divided by height in metres squared)24. For privacy reasons, NHs with fewer than 11 residents with obesity were excluded and resident age was top coded to age 89 as per human subjects research protection. After excluding NHs with missing information, the final sample included 8,814 individual NHs and 54,653 NH calendar quarters of quarterly assessments.
Dependent variable
The outcome of interest was presence of stage 2–4 PIs among high-risk NH long-stay residents with obesity. The Centers for Medicare and Medicaid Services’ NH quality of care measure limits the PIs to stage 2–4 and unstageable. For the purposes of this study, we limited PIs to stage 2–4. High-risk is defined as having one or more of the following conditions – impaired in bed mobility or transfer, comatose, or having malnutrition or being at risk for malnutrition1. The data for this variable came from the MDS 3.0 and was dichotomised as 1 for presence of stage 2–4 PIs and 0 for no such PI. NH calendar quarter quarterly assessments were sorted into four categories representing four levels of the percentage of high-risk residents with a stage 2–4 PIs. The first category was for NHs with no high-risk residents with obesity with stage 2–4 PIs during the quarter. The remaining three categories were tertiles based on the percentage of residents with obesity who experienced at least one stage 2–4 PI as shown on their quarterly assessment.
Independent variables
The conceptual framework provided guidance on other variables included in the analysis.
Structure characteristics included occupancy rate, chain entity, for-profit entity, and size based on categories of number of beds – small-sized ≤100 beds, medium-sized 101–150 beds, and large-sized >150 beds.
Process measures included percentage of residents who were restrained (physically or chemically), acuity index25, skill mix (ratio of registered nurses (RN) to other nurses), the number of RN hours per patient day (HRPPD), the number of licensed practical nurse (LPN) HRPPD, the number of CNA HRPPD, the number of severe life safety inspection deficiencies (e.g.,, fire suppression system not working), and the number of severe health inspection deficiencies (e.g., failure to adhere to infection control measures). Deficiencies are given for violations to NH regulations found during regularly scheduled inspections. Severe deficiencies are those that present potential harm to residents.
Resident antecedent conditions represent characteristics of the NH residents when they are admitted to the NH. They include the percentage of all residents with Medicaid, percentage of all residents with Medicare, percentage of all residents who were from racial/ethnic minority groups (as a proxy measure for quality of care26), and the percentage of all residents in the NH who were obese (divided into quartiles).
Environmental antecedent conditions represent characteristics of the county in which the NH is situated. They included a measure of NH market competition called the Herfindahl-Hirschman Index (HHI, sum of the NH market share of beds squared for that county)27, county per capita income divided by 10,000, the percentage of racial/ethnic minorities in the county population, the percentage of the county population less than 65 years, the core-base statistical area (CBSA) as a categorical measure of rurality (metropolitan, micropolitan and non-metro/micropolitan) and the county obesity rate. The state Medicaid per diem (measured in dollars) was also included. These measures are commonly used in NH quality of care research28,29.
Analysis
Descriptive statistics NH resident assessments previously aggregated to calendar quarters were sorted into the four categories of stage 2–4 PIs – zero event category, tertile 1, tertile 2 and tertile 3. Comparison tests (ANOVAs and Chi-Square) were used to assess differences in structure, process and antecedent condition variables among the NHs calendar quarters for the lower categories (zero event category and tertiles 1 & 2) versus the highest category (tertile 3) of stage 2–4 PIs among residents with obesity. Multivariable logistic regression was used to assess whether the variables affected the probability the NH quarter would be in the highest category of the stage 2–4 PIs among high-risk residents with obesity compared to the three lower categories. The models were additionally adjusted for annual and quarterly fixed effects, and standard errors were clustered at the facility level. Analyses were undertaken using Stata Statistical Software Release 16 (StataCorp, LLC, College Station, TX). Statistical significance was determined with an alpha of 0.05.
Results
Table 1 shows characteristics of the four categories of rates of stage 2–4 PIs among NH residents with obesity. The obesity rate for all residents of the NHs was lowest among the tertile 2 (28.97%) but was highest among the tertile 1 category (29.92%, p<0.001). The vast majority of NHs were in the zero event category (n=32,493) and the fewest NHs were in the tertile 3 category (n=6,846, p<0.001).
Table 1. Mean rates of stage 2–4 PIs residents with obesity, overall NH obesity rates among all NH residents, and number of NH quarters by category of rates of stage 2–4 PIs among residents with obesity
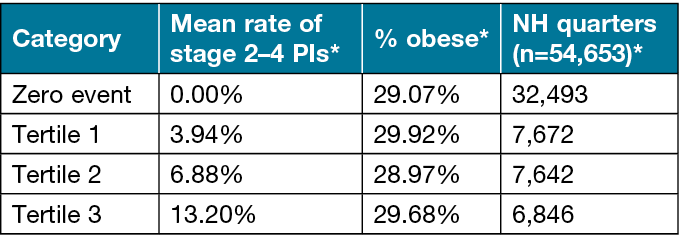
*The variation in the rates across the categories for all three measures was significant at p<0.001
Table 2 provides results of the comparison of the characteristics of NHs in the high category of stage 2–4 PIs among residents with obesity compared with NHs in the lower categories. Given the large number of NHs (n=54,653), nearly all associations were significant, and we have opted to focus on associations where the relative differences between NH in high and lower categories was at least 10% different.
Table 2. Comparison of characteristics between NHs quarters (n=54,653) in the high category of stage 2–4 PIs among high-risk residents with obesity and NHs quarters in the low categories* of stage 2–4 PIs among high-risk residents with obesity
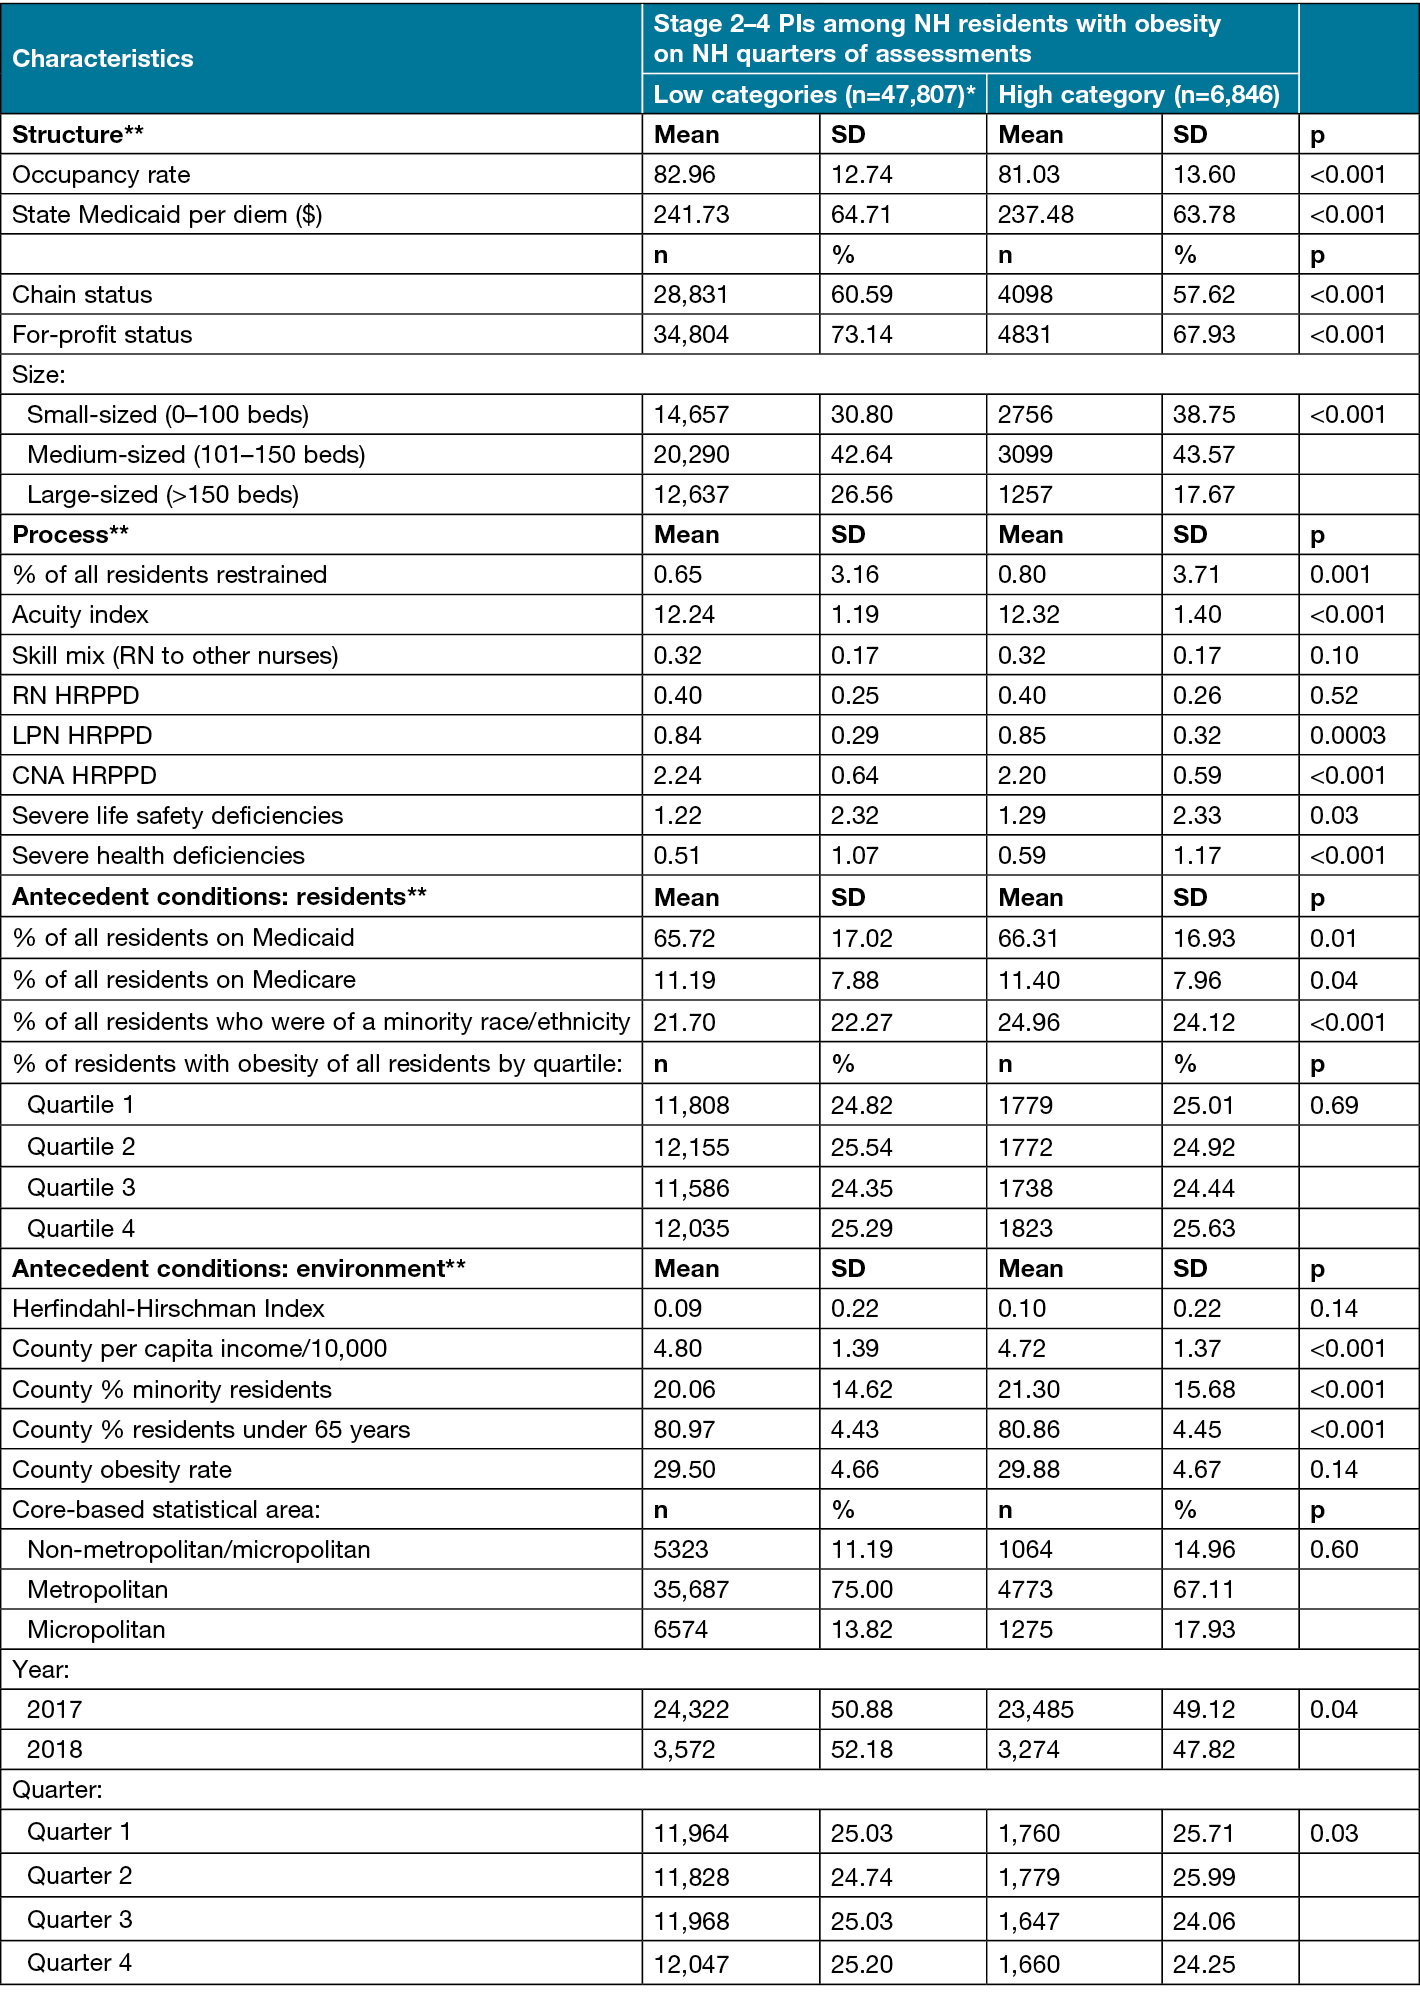
Notes: *The lower categories were the zero event category plus tertile 1 and tertile 2.
** Bolded terms are domains of the study’s conceptual framework.
CNA= Certified Nursing Assistant, HRPPD= Hours per patient day, LPN= Licensed Practical Nurse, NH= Nursing Home, PI= Pressure Injury, RN= Registered Nurse, SD=Standard Deviation.
In terms of structure characteristics, NHs with high rates of stage 2–4 PIs were less likely to be affiliated with a chain (57.62%) or a for-profit entity (67.93%) than NHs with low rates of stage 2–4 PIs (60.59% and 73.14%, p<0.001). NHs with high rates of stage 2–4 PIs were more likely to be classified as small-sized (38.75%) or medium-sized (43.57%) than NHs with low rates of stage 2–4 PIs (30.80% and 42.64%, p<0.001). On the other hand, there was a higher percentage of large-sized NHs among NHs with low rates of stage 2–4 PIs (26.56%) than NHs with high rates of stage 2–4 PIs (17.67%, p<0.001).
Among process measures, 0.80% of residents in NHs with high rates of stage 2–4 PIs were restrained compared with 0.65% of residents in NHs with lower rates of stage 2–4 PIs (p=0.001). NHs with high rates of stage 2–4 PIs had higher rates of severe health deficiencies (1.17) than NHs with lower rates of stage 2–4 PIs (1.07, p<0.001).
Among resident antecedent characteristics, there was a significantly higher percentage of racial/ethnic minority residents of NHs with high rates of stage 2–4 PIs (24.12%) compared to NHs with lower rates of stage 2–4 PIs (22.27%, p<0.001). There were no environmental antecedent characteristics that met the 10% threshold.
Results of the multivariable logistic regression to identify characteristics statistically related to NHs having high rates of stage 2–4 PIs among residents with obesity are shown in Table 3.
Table 3. Multivariate logistic regression analysis of characteristics associated with NHs quarters (n=54,653) being in the highest category (n=6,846) of stage 2–4 PIs among residents with obesity compared to the lower categories (n=47,807) of stage 2–4 PIs among residents with obesity.
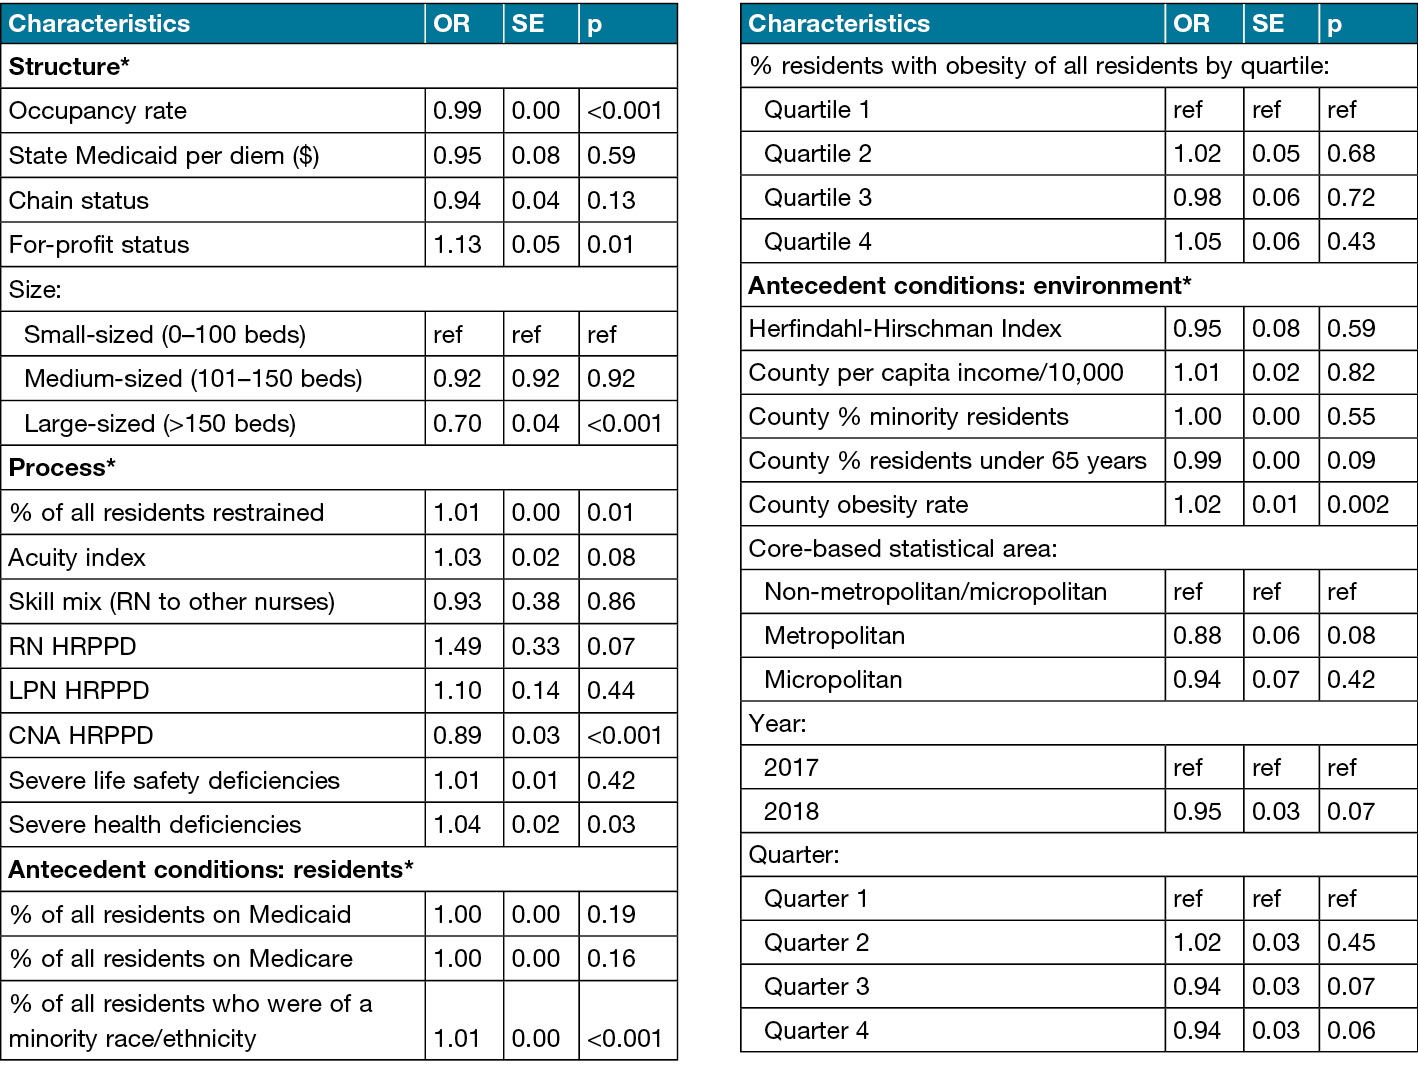
CNA=Certified Nursing Assistant, HRPPD= Hours per patient day, LPN=Licensed Practical Nurse, NH=Nursing Home, OR=Odds Ratio, PI=Pressure Injury, RN= Registered Nurse, SE=Standard Error.
*Bolded terms are domains of the study’s conceptual framework.
Structure characteristics
As occupancy rate increased, the odds of a NH being in the highest category of stage 2–4 PIs decreased by 1% (OR=0.99; p<0.001). NHs that were for-profit had 13% greater odds of being in the highest category of stage 2–4 PIs (OR=1.13, p<0.001). Compared with NHs that are small-sized, NHs that were large-sized had 30% lower odds of being in the highest category of stage 2–4 PIs (OR=0.70, p<0.001).
Process characteristics
For each additional percentage increase in the number of NH residents who were restrained, the odds of NH quarters being in the highest category of stage 2–4 PIs increased by 1% (OR=1.01, p=0.01). NHs with a higher number of CNA HRPPD had 11% lower odds of being in the highest category of stage 2–4 PIs (OR=0.89, p<0.001). As the number of severe health deficiencies increased, the odds of NHs being in the highest category of stage 2–4 PIs increased by 4% (OR=1.04, p<0.001).
Resident antecedent characteristics
Each additional percentage of racial/ethnic minority residents increased the odds of NH being in the highest category of stage 2–4 PIs by 1% (OR=1.01, p<0.001).
Environmental antecedent characteristics
The county obesity rate was significantly associated with increased odds of NH being in the highest category of stage 2–4 PIs (OR=1.02, p=0.002).
Discussion
Development of PIs among NH residents is an indication of poor quality NH care1. Previous research has documented characteristics of residents with obesity that put them at risk for PIs. These included limited mobility, pressure due to excess body weight, and skin shears during movement16,19. However, limited evidence exists as to what characteristics of NHs may be associated with increased risk of PIs among residents with obesity.
We identified eight NH characteristics that varied significantly between NHs with low rates of stage 2–4 PIs among their high-risk residents with obesity and NHs with high rates of stage 2–4 PIs among their high-risk residents with obesity. Although these eight characteristics reach the level of statistical significance (p≤0.05), not all of the characteristics showed enough effect to have clinical significance or implications for clinical practice30. Therefore, we will focus our discussion only on the three characteristics for which the effect on the odds was at least 10% – for-profit status, large facilities, and the hours of CNA HRPPD.
For-profit status
In the descriptive analysis, we found there was a significantly lower percentage of for-profit NHs in the high category of rates of stage 2–4 PIs among high-risk residents with obesity. However, in the fully adjusted models, we found the opposite, that is for-profit NHs were associated with a 13% increase in the odds that NHs would be in the high category of rates of stage 2–4 PIs among their high-risk residents with obesity. The literature lacked any evidence that we could locate on the association between high rates of PIs among NH residents and for-profit NH status. However, the literature does indicate an association between for-profit NHs and lower quality of NH care31,32, and PIs among NH residents is an indicator of poorer quality NH care1. For-profit NHs may have a valuable opportunity to address the issue of having an elevated risk for persons with obesity with stage 2–4 PIs by implementing specific interventions to prevent PIs33.
Although not focused on residents with obesity, several studies show promising interventions for PI prevention among NH residents33,34. One successfully implemented care bundles that addressed three elements – support surfaces, skin inspections and repositioning. The care bundles would have to be modified to support the needs of residents with obesity, including support surfaces and beds that are bariatric rated. The study also included suggestions for deployment of trained staff members to serve as “skin champions” to support evidence-based wound care among other staff members33. For the skin champions to be effective in caring for residents with obesity, they would need training in their special skin care needs, such as the risk of PIs in skin folds and in the suprapubic area16.
Another study tested the use of high-density foam mattresses and three turning frequencies – every 2 hours, 3 hours and 4 hours. Only 19 of the 942 residents in the study developed stage 1–2 PIs, although there was no difference in PI incidence based on the frequency of turning34. Turning residents with obesity every 4 hours vs every 2 hours would reduce demand on staff as well as potential staff injuries as turning would be less frequent. Although these may suffice for residents who are not obese, Hasesler35(p.158) provides clinical practice recommendations for the prevention of PIs among residents with obesity:
- “Conduct a structured risk assessment that considers factors that may increase the risk for PIs for an individual with overweight and obesity (Grade A).
- Refer individuals with overweight and obesity to an accredited practicing dietitian (APD) for a nutritional assessment and development of an appropriate nutrition management plan (Grade B).
- Assess skin and skin folds and perform preventive skin care (Grade B).
- Evaluate safety of equipment for bariatric use, select chairs and beds with adequate dimensions for safe repositioning and evaluate ‘bottoming out’ (Grade B).
- Provide a high specification pressure redistribution support surface (Grade A).
- Consider using a bed system with advanced microclimate technology (Grade B).
- Regularly reposition the individual using appropriate repositioning aids and encourage early mobilisation (Grade A)”.
However, such a combination (e.g., mattress/turning frequency + comprehensive protocol) should be tested to determine clinical effectiveness for residents with obesity.
Large facilities
We found the odds of NHs having high rates of PIs among their residents with obesity was reduced by 30% in large facilities. This suggests larger facilities are providing higher quality of care for their residents with obesity. This is counter to the results of a systematic review showing smaller NHs provided higher quality of care not specific to residents with obesity compared to larger NHs36. Larger NHs may have more staff on hand to support appropriate turning practices to minimise PIs among high-risk NH residents, including those who are obese. Moreover, larger NHs may enjoy economies of scale that leave them with extra resources to support specialised care, including resources such as specialised bariatric units. Although recommended in the literature14,37, there are no known studies that provide evidence of bariatric care units in NHs improving outcomes for residents with obesity. As obesity rates in NHs increase11,12, such a study would be important given the additional care needed by residents with obesity14,15,19,38,39.
CNA HRPPD
We found that a 1-hour increase in CNA HRPPD reduced the odds of NHs having high rates of PIs among their residents with obesity by 11%. This is similar to the findings of Cai et al who found that the odds of PIs among residents with moderate or severe obesity increased 18.9% in NHs with low levels of CNAs18. These results are supported by our finding that larger NHs have lower rates of PIs among their residents with obesity, most likely because they have more staff on hand. Felix14 and others15,38 have documented that residents with obesity require two or more staff for assistance with activities of daily living, suggesting that two or more staff would be necessary for turning as well. Specialised bariatric units could have increased staff to account for this extra needed staff assistance for residents with obesity and well as needed bariatric equipment. However, given there is no evidence on outcomes among residents with obesity living in bariatric units, a study of bariatric units in NHs is warranted.
Limitations
There are more than 15,000 NHs in the US. However, once we merged available facility level data and excluded NHs with less than 11 residents with obesity and missing data, our final sample included only 8,814 individual NHs. The NHs we did not include in the analysis may be different from the NHs included in the analysis, thereby raising the issue of selection bias. Additionally, a recent study found that NHs underreport PIs among their residents5. This suggests that our results may be somewhat attenuated. Despite these limitations, this study presents new information about organisational factors associated with PIs among residents with obesity and potential targets to address to improve PI prevention among NH residents with obesity.
Conclusions
PIs are a serious issue for residents in NHs, and emerging evidence indicates residents with obesity are at higher risk for PIs. NH staff may not be familiar with the special skin care needs of residents with obesity to minimise the risk of PIs. With the increasing rates of residents with obesity in NHs, it is important to develop interventions for NH staff to prevent them from occurring.
This study identified several NH characteristics (for-profit status, large facilities and hours of CNA HRPPD) that are associated with higher risk for PIs among residents with obesity, which can be targeted with evidence-based interventions to reduce the risk of these adverse safety events occurring among this growing NH population group.
Conflict of interest
The authors declare no conflicts of interest.
Ethics statement
Human subjects’ protections. The Institutional Review Board of the University of Arkansas for Medical Sciences approved the study’s research protocol.
Funding
This study was funded by a grant from the US Agency for Healthcare Research and Quality (award number: 1R01HS025703). This project was further supported by the National Institutes of Health (NIH, K76AG074920 to) and the Translational Research Institute (TRI) UL1 TR003107 (UAMS) through the National Center for Advancing Translational Sciences (NCATS) of the NIH.
Author contribution
The authors confirm contribution to the paper as follows: HF designed the study; RW-M & CWB approved the study design; CCB led the analysis; HF assisted with the analysis; M-RN lead data management; JA assisted with data management; HF drafted the first version of the manuscript; CCB, M-RN, JV, JA, RW-M & CWB edited the first version of the manuscript; and HF, M-RN, JV, JA, RW-M & CWB made revisions to subsequent drafts. All authors approved the final version.
Conflict of interest
The authors declare no conflicts of interest.
Ethics statement
An ethics statement is not applicable.
Funding
The authors received no funding for this study.
Author(s)
Holly C Felix*1, Clare C Brown1, Marie-Rachelle Narcisse2, Jennifer L Vincenzo3,
Jennifer A Andersen4, Christine W Bradway5, Robert Weech-Maldonado6
1Fay W Boozman College of Public Health, University of Arkansas for Medical Sciences, 4301 West Markham Street, Slot 820, Little Rock, AR 72205, USA
2Warren Alpert Medical School, Brown University, 222 Richmond Street, Providence, RI, 02903 USA
3College of Health Professions, University of Arkansas for Medical Sciences, 1125 N. College Avenue, Fayetteville, AR 72703, USA
4College of Medicine, University of Arkansas for Medical Sciences, 2708 South 48th Street, Springdale, AR 72762, USA
5School of Nursing, University of Pennsylvania, 418 Curie Boulevard, Fagin Hall, Room 312, Philadelphia, PA 19104-4217, USA
6School of Health Professions, University of Alabama at Birmingham, 1720 2nd Avenue South, SHPB 558, Birmingham, AL 35294, USA
*Corresponding author email felixholly@uams.edu
References
- CMS. Quality measures’ 2023. Available from: https://www.cms.gov/medicare/quality-initiatives-patient-assessment-instruments/nursinghomequalityinits/nhqiqualitymeasures
- Kottner J, Cuddigan J, Carville K, Balzar K, Berlowitz D, Law S, et al. Pressure ulcer/injury classification today: an international perspective. J Tissue Viab 2020;29:197–203.
- Edsberg LE, Black JM, Goldberg M, McNichol L, Moore L, Sieggreen M. Revised National Pressure Ulcer Advisory Panel pressure injury staging system: revised pressure injury staging system. Wound Ostomy Continence Nurs J 2016;43(6):585–97.
- CMS. Nursing home data compendium 2015. In: DHHS, editor. Baltimore, MD: CMS; 2015. p. 1–243.
- Chen Z, Gleason LJ, Sanghavi P. Accuracy of pressure ulcer events in US nursing home ratings. Medical Care 2022;60(10):775–83.
- Allman RM. Pressure ulcer prevalence, incidence, risk factors, and impact. Clin Geriatr Med 1997;13(3):421–36.
- Gruneir A, Mor V. Nursing home safety: current issues and barriers to improvement. Annual Rev Public Health 2008;29:369–82.
- Comondore V, Devereaux P, Zhou Q, Stone S, Busse J, Ravindran N, et al. Quality of care in for-profit and not-for-profit nursing homes: systematic review and meta-analysis. BMJ 2009;4:b2723.
- Alipoor E, Mehrdadi P, Yaseri M, Hosseinzadeh-Attar MJ. Association of overweight and obesity with the prevalence and incidence of pressure ulcers: a systematic review and meta-analysis. Clin Nutr 2021;40(9):5089–98.
- Chen F, Wang X, Pan Y, Ni B, Wu J. The paradox of obesity in pressure ulcers of critically ill patients. Int Wound J 2023;20(7):2753–63.
- Felix HC, Bradway C, Chisholm L, Pradhan R, Weech-Maldonado R. Prevalence of moderate to severe obesity among US nursing home residents, 2000–2010. Res Gerontolog Nurs 2015;8(4):173–8.
- Zhang N, Field T, Mazor KM, Zhou Y, Lapane KL, Gurwitz JH. The increasing prevalence of obesity in residents of U.S. nursing homes: 2005–2015. Biol Sci Med Sci 2019;74(12):1929–36.
- CDC. Adult obesity prevalence maps; 2023.
- Felix H. Personal care assistance needs of obese elders entering nursing homes. J Am Med Director Assoc 2008;9(5):139–326.
- Harris JA, Engberg J, Castle NG. Obesity and intensive staffing needs of nursing home residents. Geriatr Nurs 2018;39(6):696–701.
- Gallagher S. The challenges of obesity and skin integrity. Nurs Clin North Am 2005;40:325–35.
- GAO. Nursing home quality: prevalence of serious problems, while declining, reinforces importance of enhanced oversight. Washington, DC: General Accounting Office; 2003.
- Cai S, Rahman M, Intrator O. Obesity and pressure ulcers among nursing home residents. Med Care 2013;51(6):478–86.
- Gallagher S, Langlois C, Spacht D, Blackett A, Henns T. Preplanning with protocols for skin and wound care in obese patients. Adv Skin Wound Care 2004;7(8):436–43.
- Koenen M, Hill M, Cohen P, Sowers J. Obesity, adipose tissue and vascular dysfunction. Circulat Res 2021;128(7):951–68.
- Coleman S, Gorecki C, Nelson E, Closs S, DeFloor T, Halfen R, et al. Patient risk factors for pressure ulcer development: systematic review. Int J Nurs Stud 2013;50(7):974–1003.
- Donabedian A. Evaluating the quality of medical care. Milbank Quart 2005;2083(2004):2691–729.
- Coyle YM, Battles JB. Using antecedents of medical care to develop valid quality of care measures. Int J Qual Health Care 1999;11(1):5–12.
- Nuttall FQ. Body mass index: obesity, BMI, and health: a critical review. Nutrit Today 2015;50(3):117–28.
- Hyer K, Thomas KS, Branch LG, Harman JS, Johnson CE, Weech-Maldonado R. The influence of nurse staffing levels on quality of care in nursing homes. Gerontol 2011;51(5):610–6.
- Mor V, Angelelli J, Teno J, Miller S. Driven to tiers: socio-economic and racial disparities in the quality of nursing home care. Milbank Quart 2004;82(2):227–56.
- Weech-Maldonado R, Pradhan R, Dayama N, Lord J, Gupta S. Nursing home quality and financial performance: is there a business case for quality? Inquiry 2019;56:1–10.
- National Academies of Sciences. The national imperative to improve nursing home quality: honoring our commitment to residents, families and staff. Washington DC: The National Academy Presses; 2022. p. 1–577.
- Dellefield ME, Castle NG, McGilton KS, Spilsbury K. The relationship between registered nurses and nursing home quality: an integrative review (2008–2014). Nurs Econ 2015;33(2):95–108, 16.
- Ranganathan P, Pramesh CS, Buyse M. Common pitfalls in statistical analysis: clinical versus statistical significance. Perspect Clin Res 2015;6(3):169–70.
- Hillmer MP, Wodchis WP, Gill SS, Anderson GM, Rochon PA. Nursing home profit status and quality of care: is there any evidence of an association? Med Care Res Rev 2005;62(2):139–66.
- O’Neill C, Harrington C, Kitchener M, Saliba D. Quality of care in nursing homes: an analysis of relationships among profit, quality, and ownership. Med Care 2003;41(12):1318–30.
- Lavallée JF, Gray TA, Dumville J, Cullum N. Preventing pressure ulcers in nursing homes using a care bundle: a feasibility study. Health Soc Care Comm 2019;27(4):e417-e27.
- Bergstrom N, Horn SD, Rapp M, Stern A, Barrett R, Watkiss M, Krahn M. Preventing pressure ulcers: a multisite randomized controlled trial in nursing homes. Ont Health Techno Ass Ser 2014;14(11):1–32.
- Hasesler E. Evidence summary: prevention of pressure injuries in individuals with overweight or obesity. Wound Pract Res 2018;26(3):158–61.
- Baldwin R, Chenoweth L, Dela Rama M, Wang AY. Does size matter in aged care facilities? A literature review of the relationship between the number of facility beds and quality. Health Care Manage Rev 2017;42(4):315–27.
- Dimant J. Bariatric programs in nursing homes. Clin Geriatr Med 2005;21:767–92.
- Kosar CM, Thomas KS, Gozzalo PL, Mor V. Higher level of obesity is associated with intensive personal care assistance in the nursing homes. J Am Med Director Assoc 2018;19(11):1015–9.
- Porter-Starr KN, McDonald SR, Weidner JA, Bales CW. Challenges in the management of geriatric obesity in high-risk populations. Nutrient 2016;8:262.